Debugging Tests
VS Code debugger
We recommend using the VS Code Extension for debugging for a better developer experience. With the VS Code extension you can debug your tests right in VS Code, see error messages, set breakpoints and step through your tests.
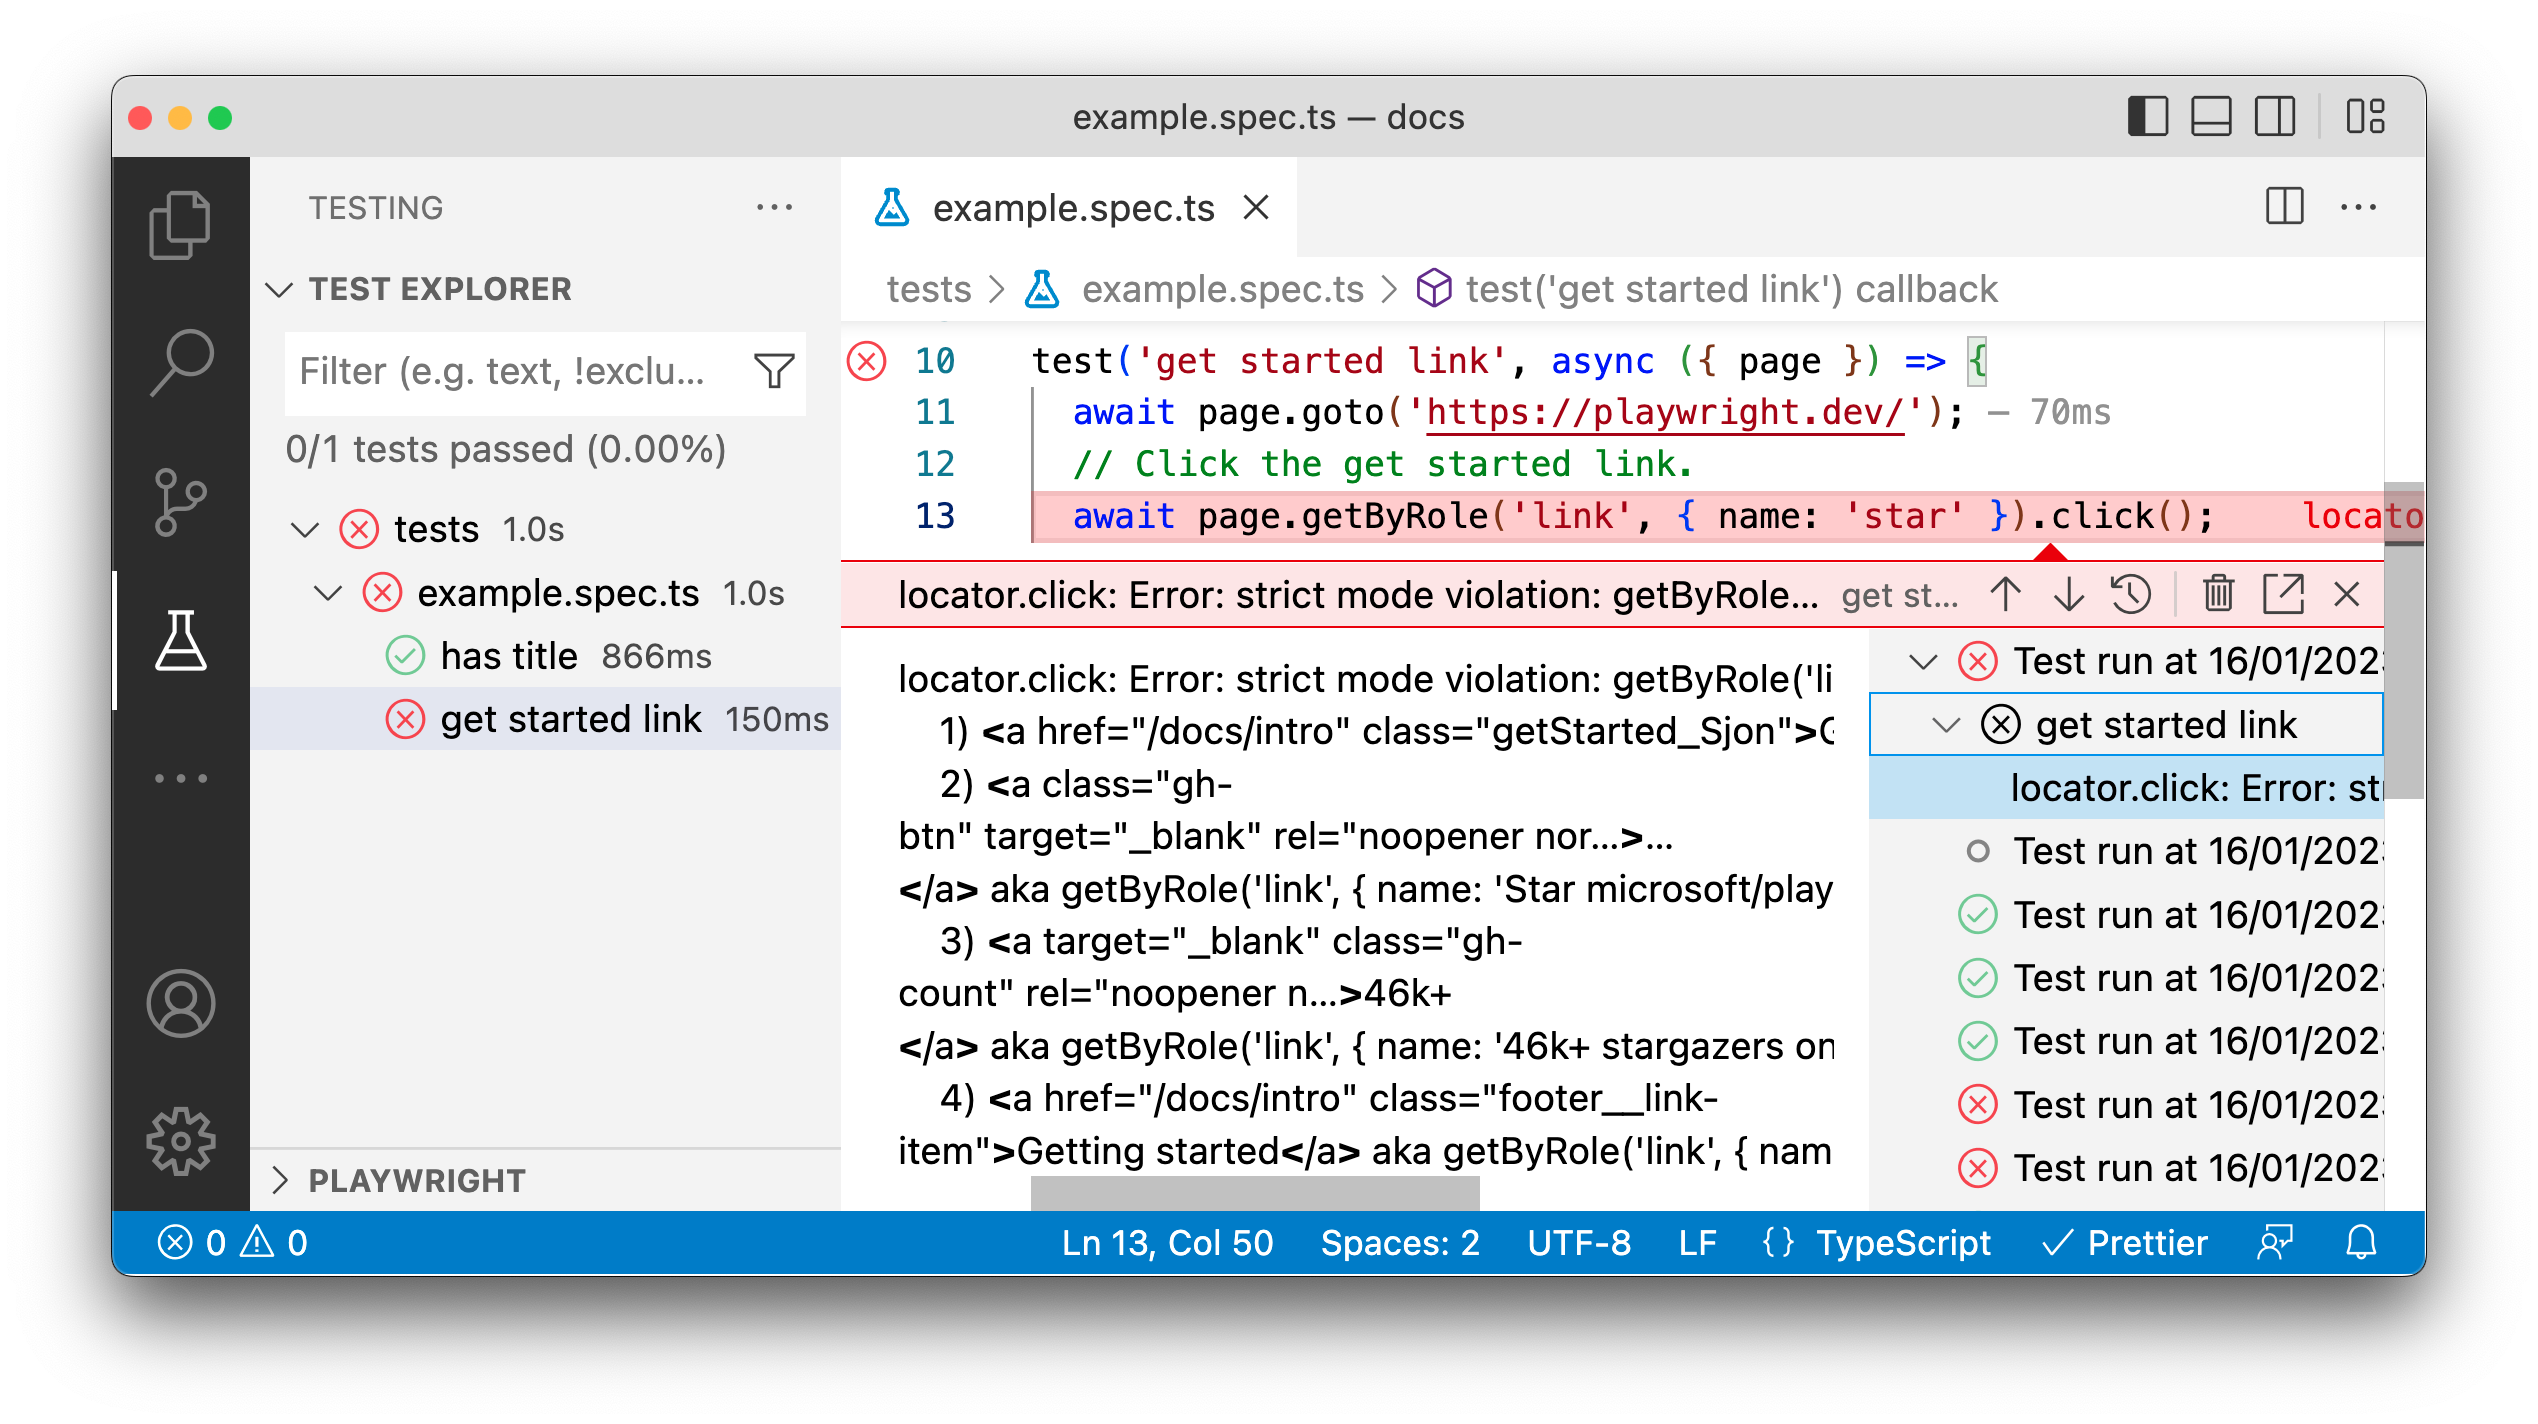
Error Messages
If your test fails VS Code will show you error messages right in the editor showing what was expected, what was received as well as a complete call log.
Live Debugging
You can debug your test live in VS Code. After running a test with the Show Browser option checked, click on any of the locators in VS Code and it will be highlighted in the Browser window. Playwright will also show you if there are multiple matches.
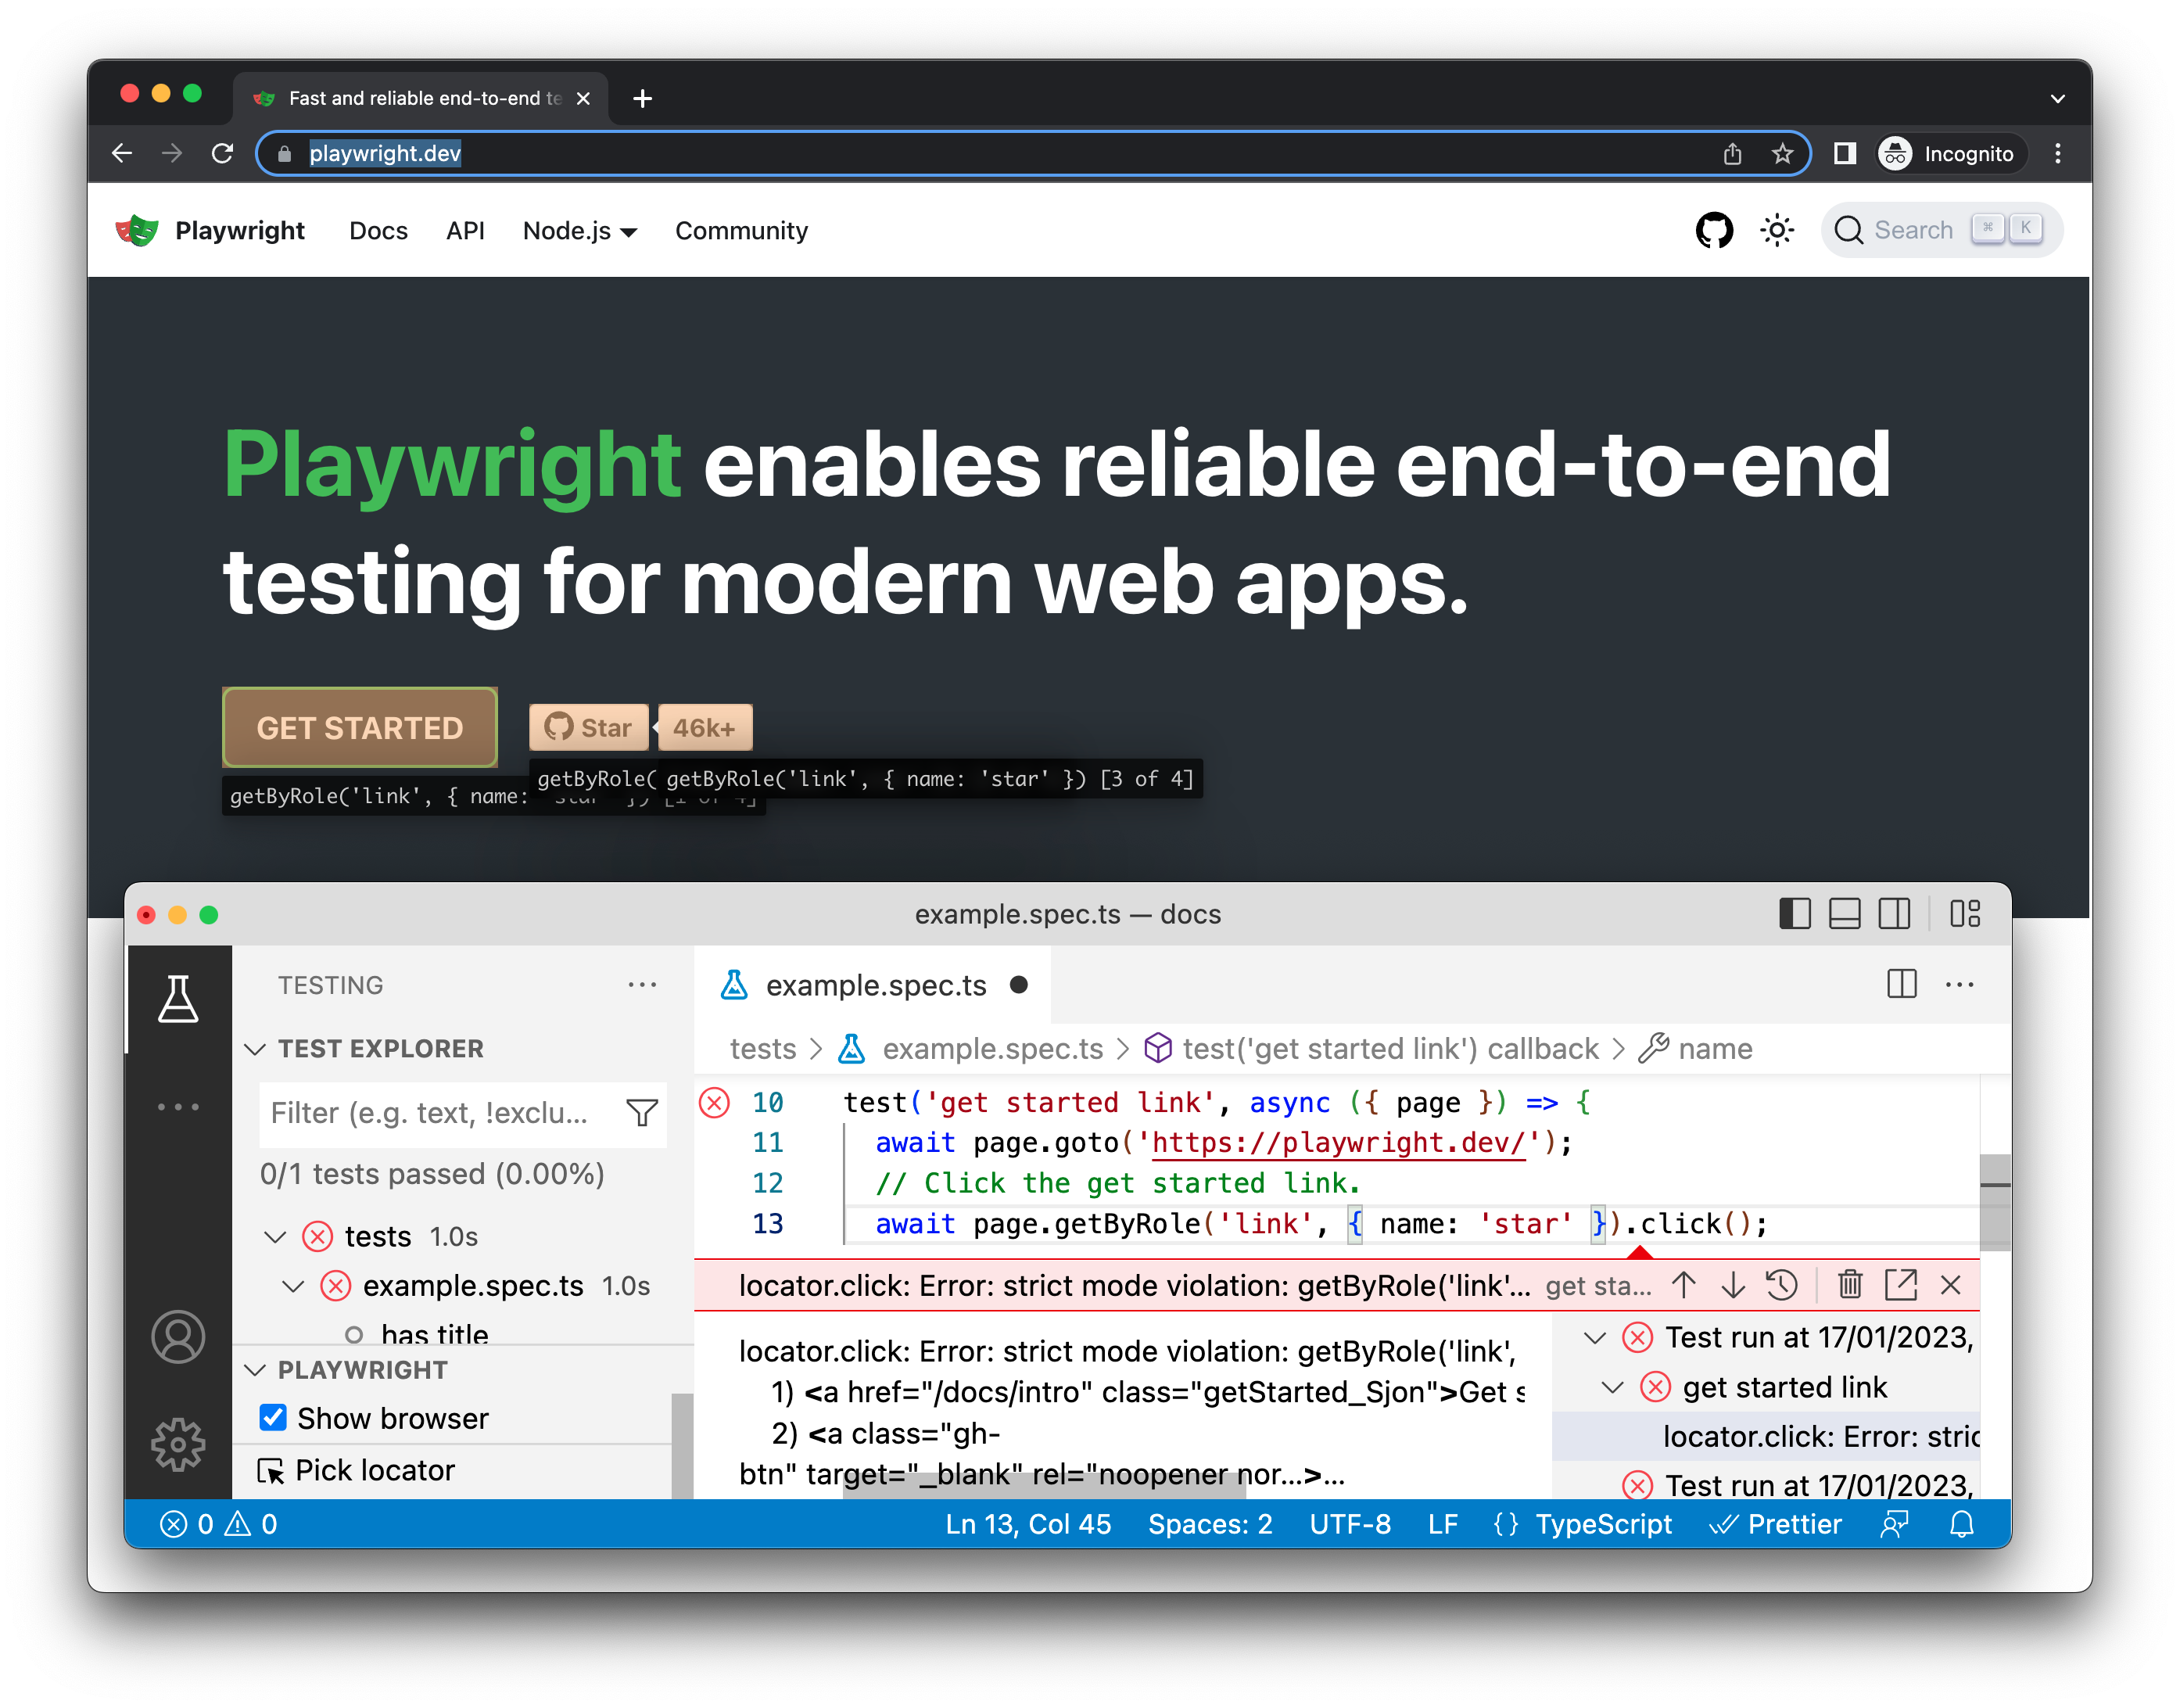
You can also edit the locators in VS Code and Playwright will show you the changes live in the browser window.
Picking a Locator
Pick a locator and copy it into your test file by clicking the Pick locator button form the testing sidebar. Then in the browser click the element you require and it will now show up in the Pick locator box in VS Code. Press 'enter' on your keyboard to copy the locator into the clipboard and then paste anywhere in your code. Or press 'escape' if you want to cancel.
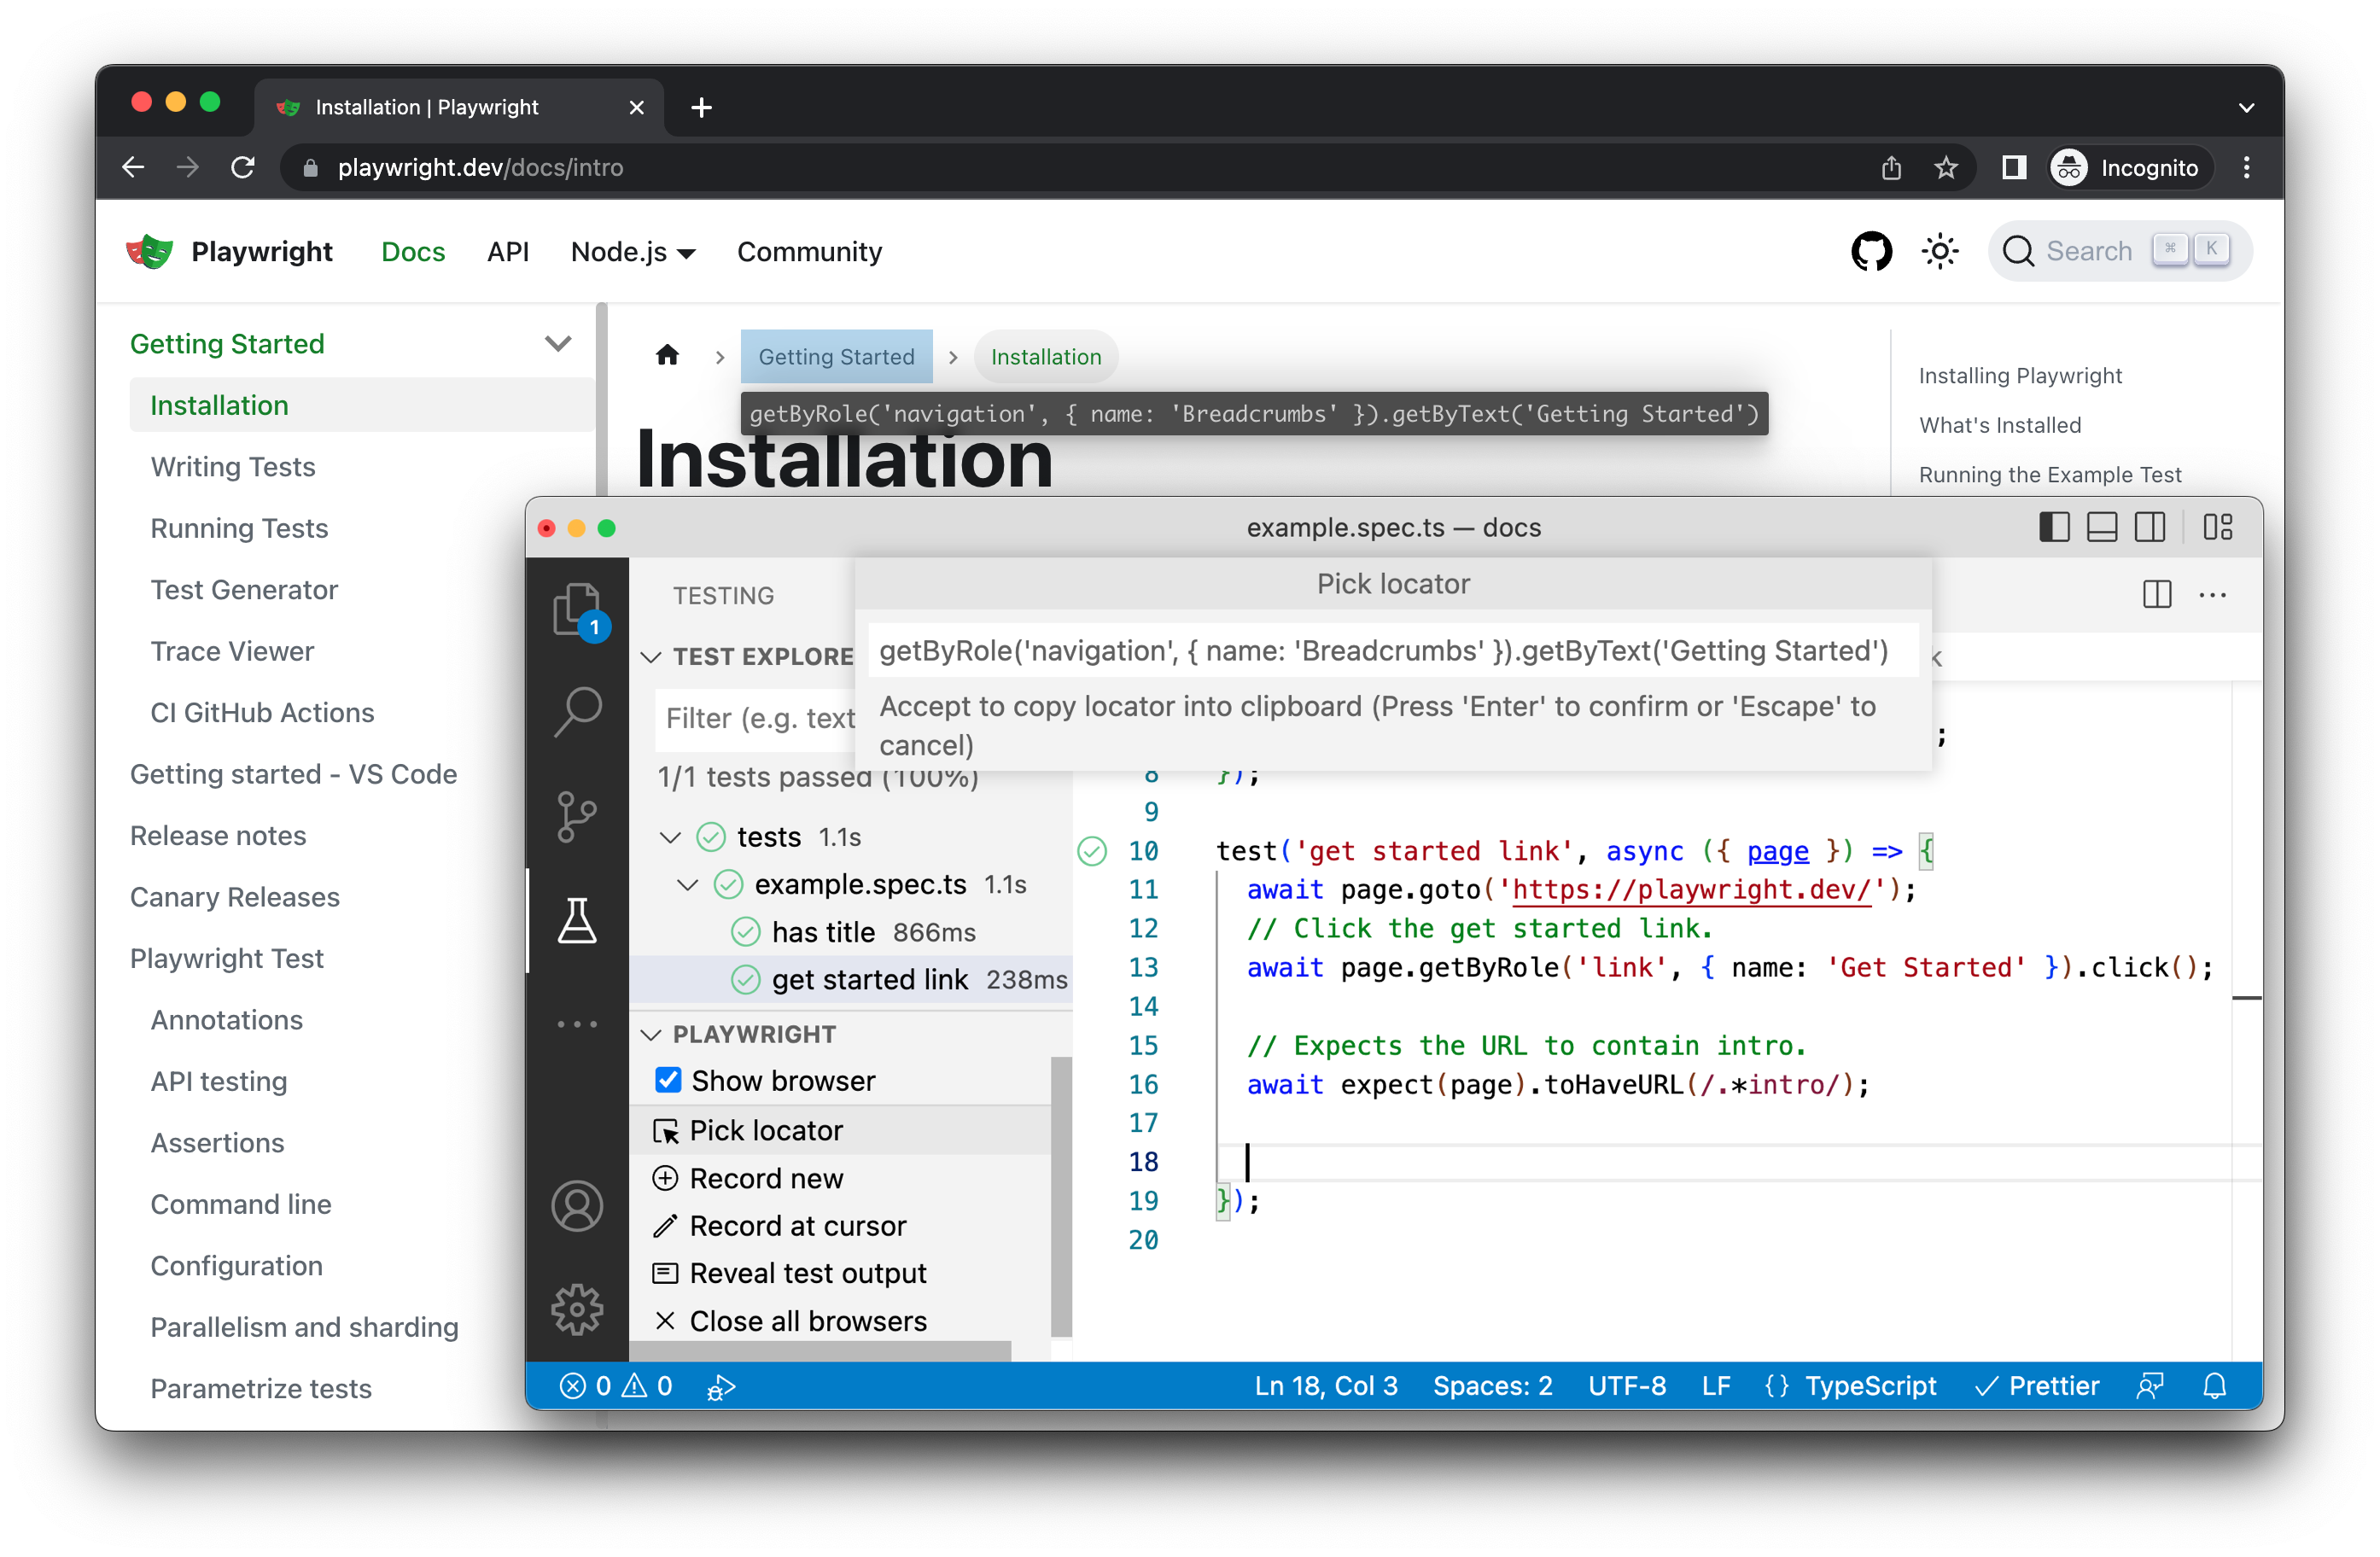
Playwright will look at your page and figure out the best locator, prioritizing role, text and test id locators. If Playwright finds multiple elements matching the locator, it will improve the locator to make it resilient and uniquely identify the target element, so you don't have to worry about failing tests due to locators.
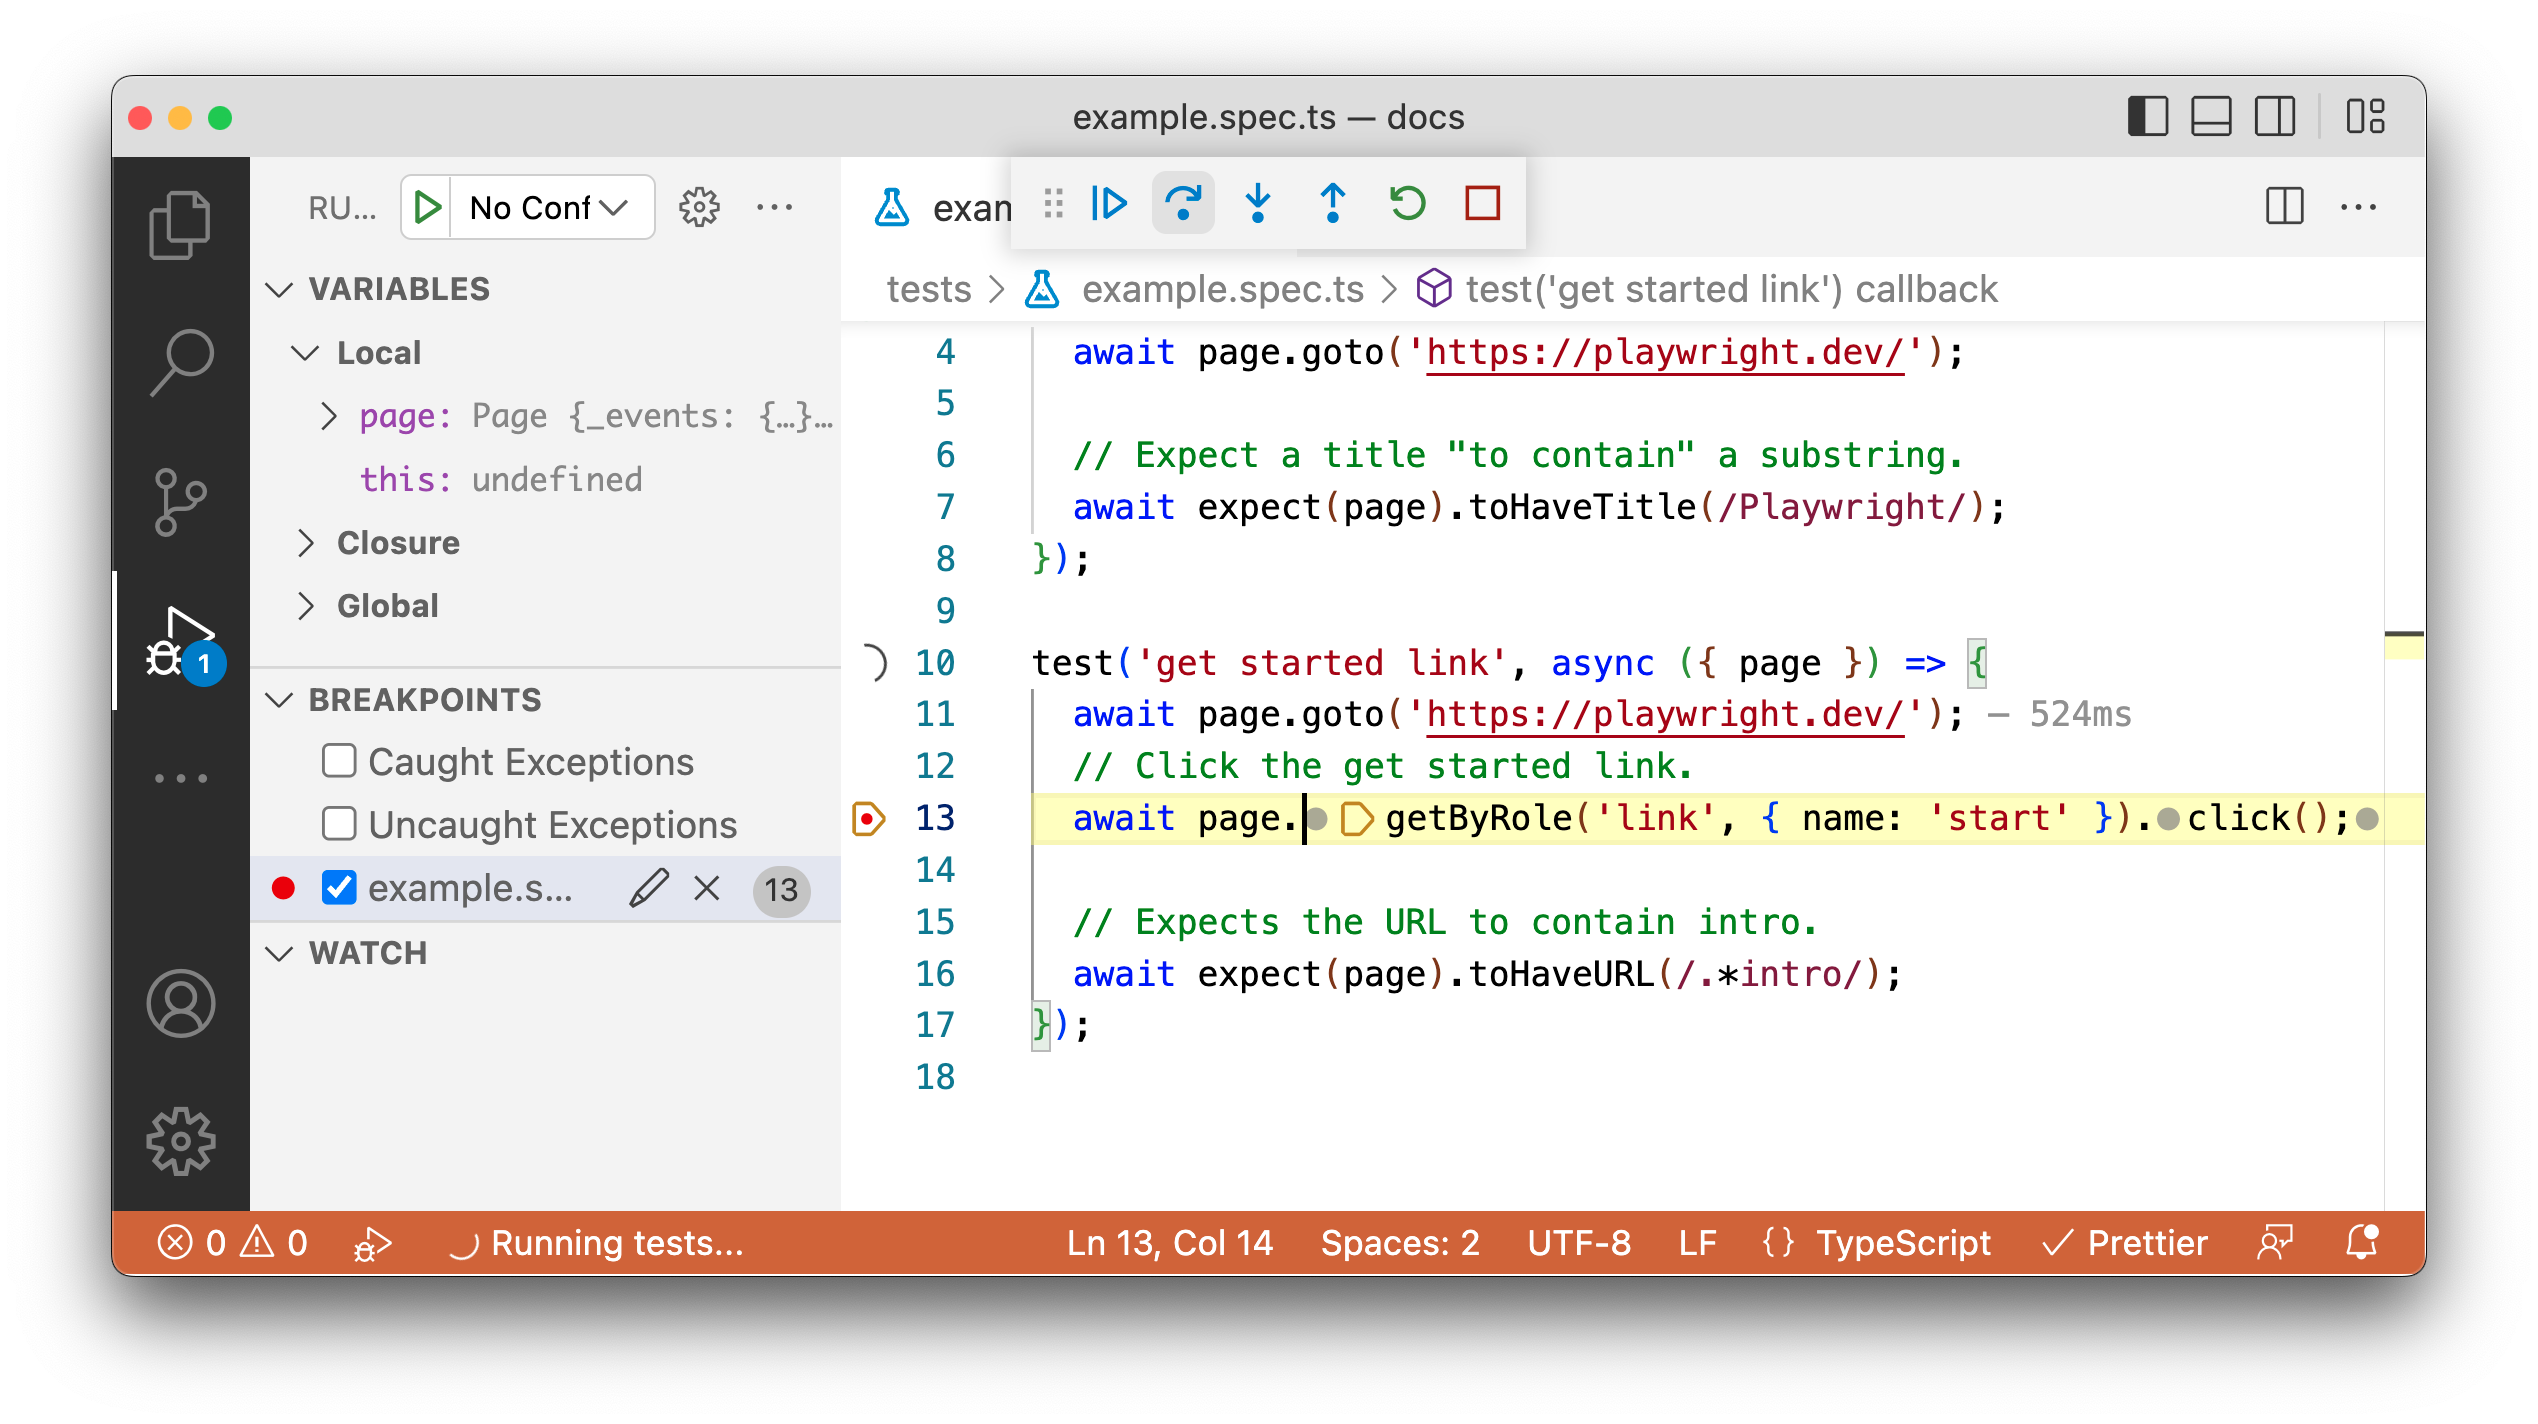
Run in Debug Mode
To set a breakpoint click next to the line number where you want the breakpoint to be until a red dot appears. Run the tests in debug mode by right clicking on the line next to the test you want to run.
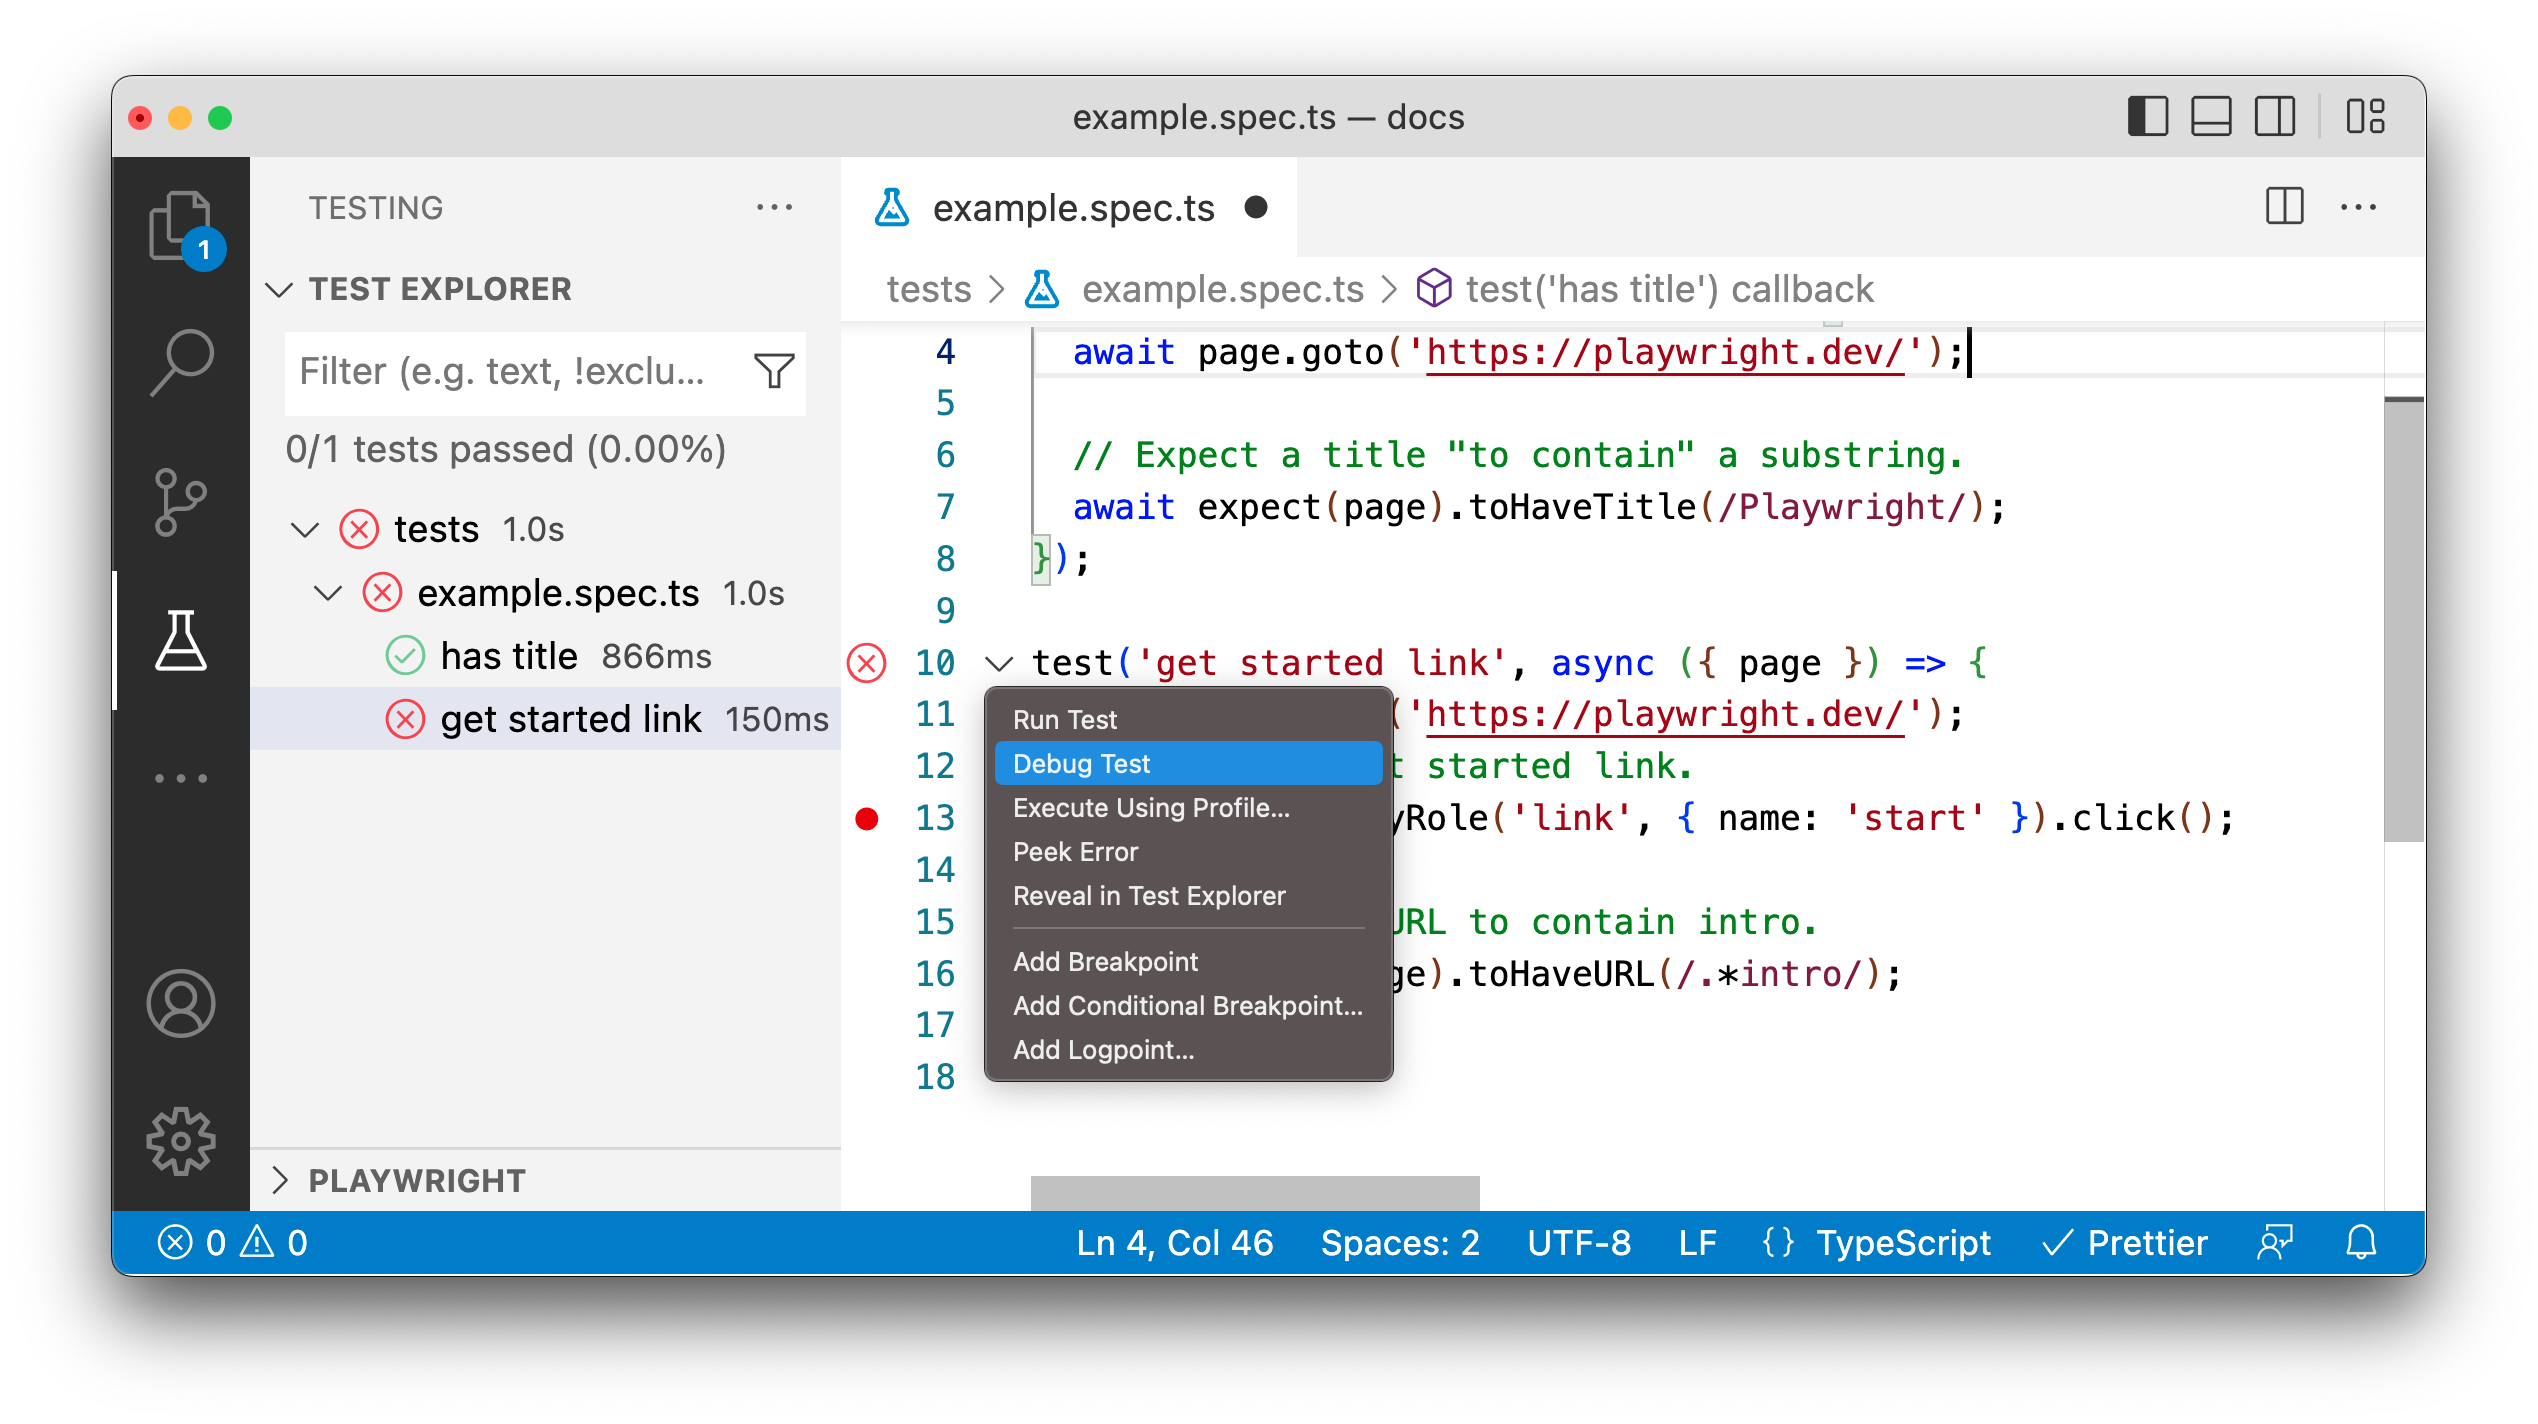
A browser window will open and the test will run and pause at where the breakpoint is set. You can step through the tests, pause the test and rerun the tests from the menu in VS Code.
Debug in different Browsers
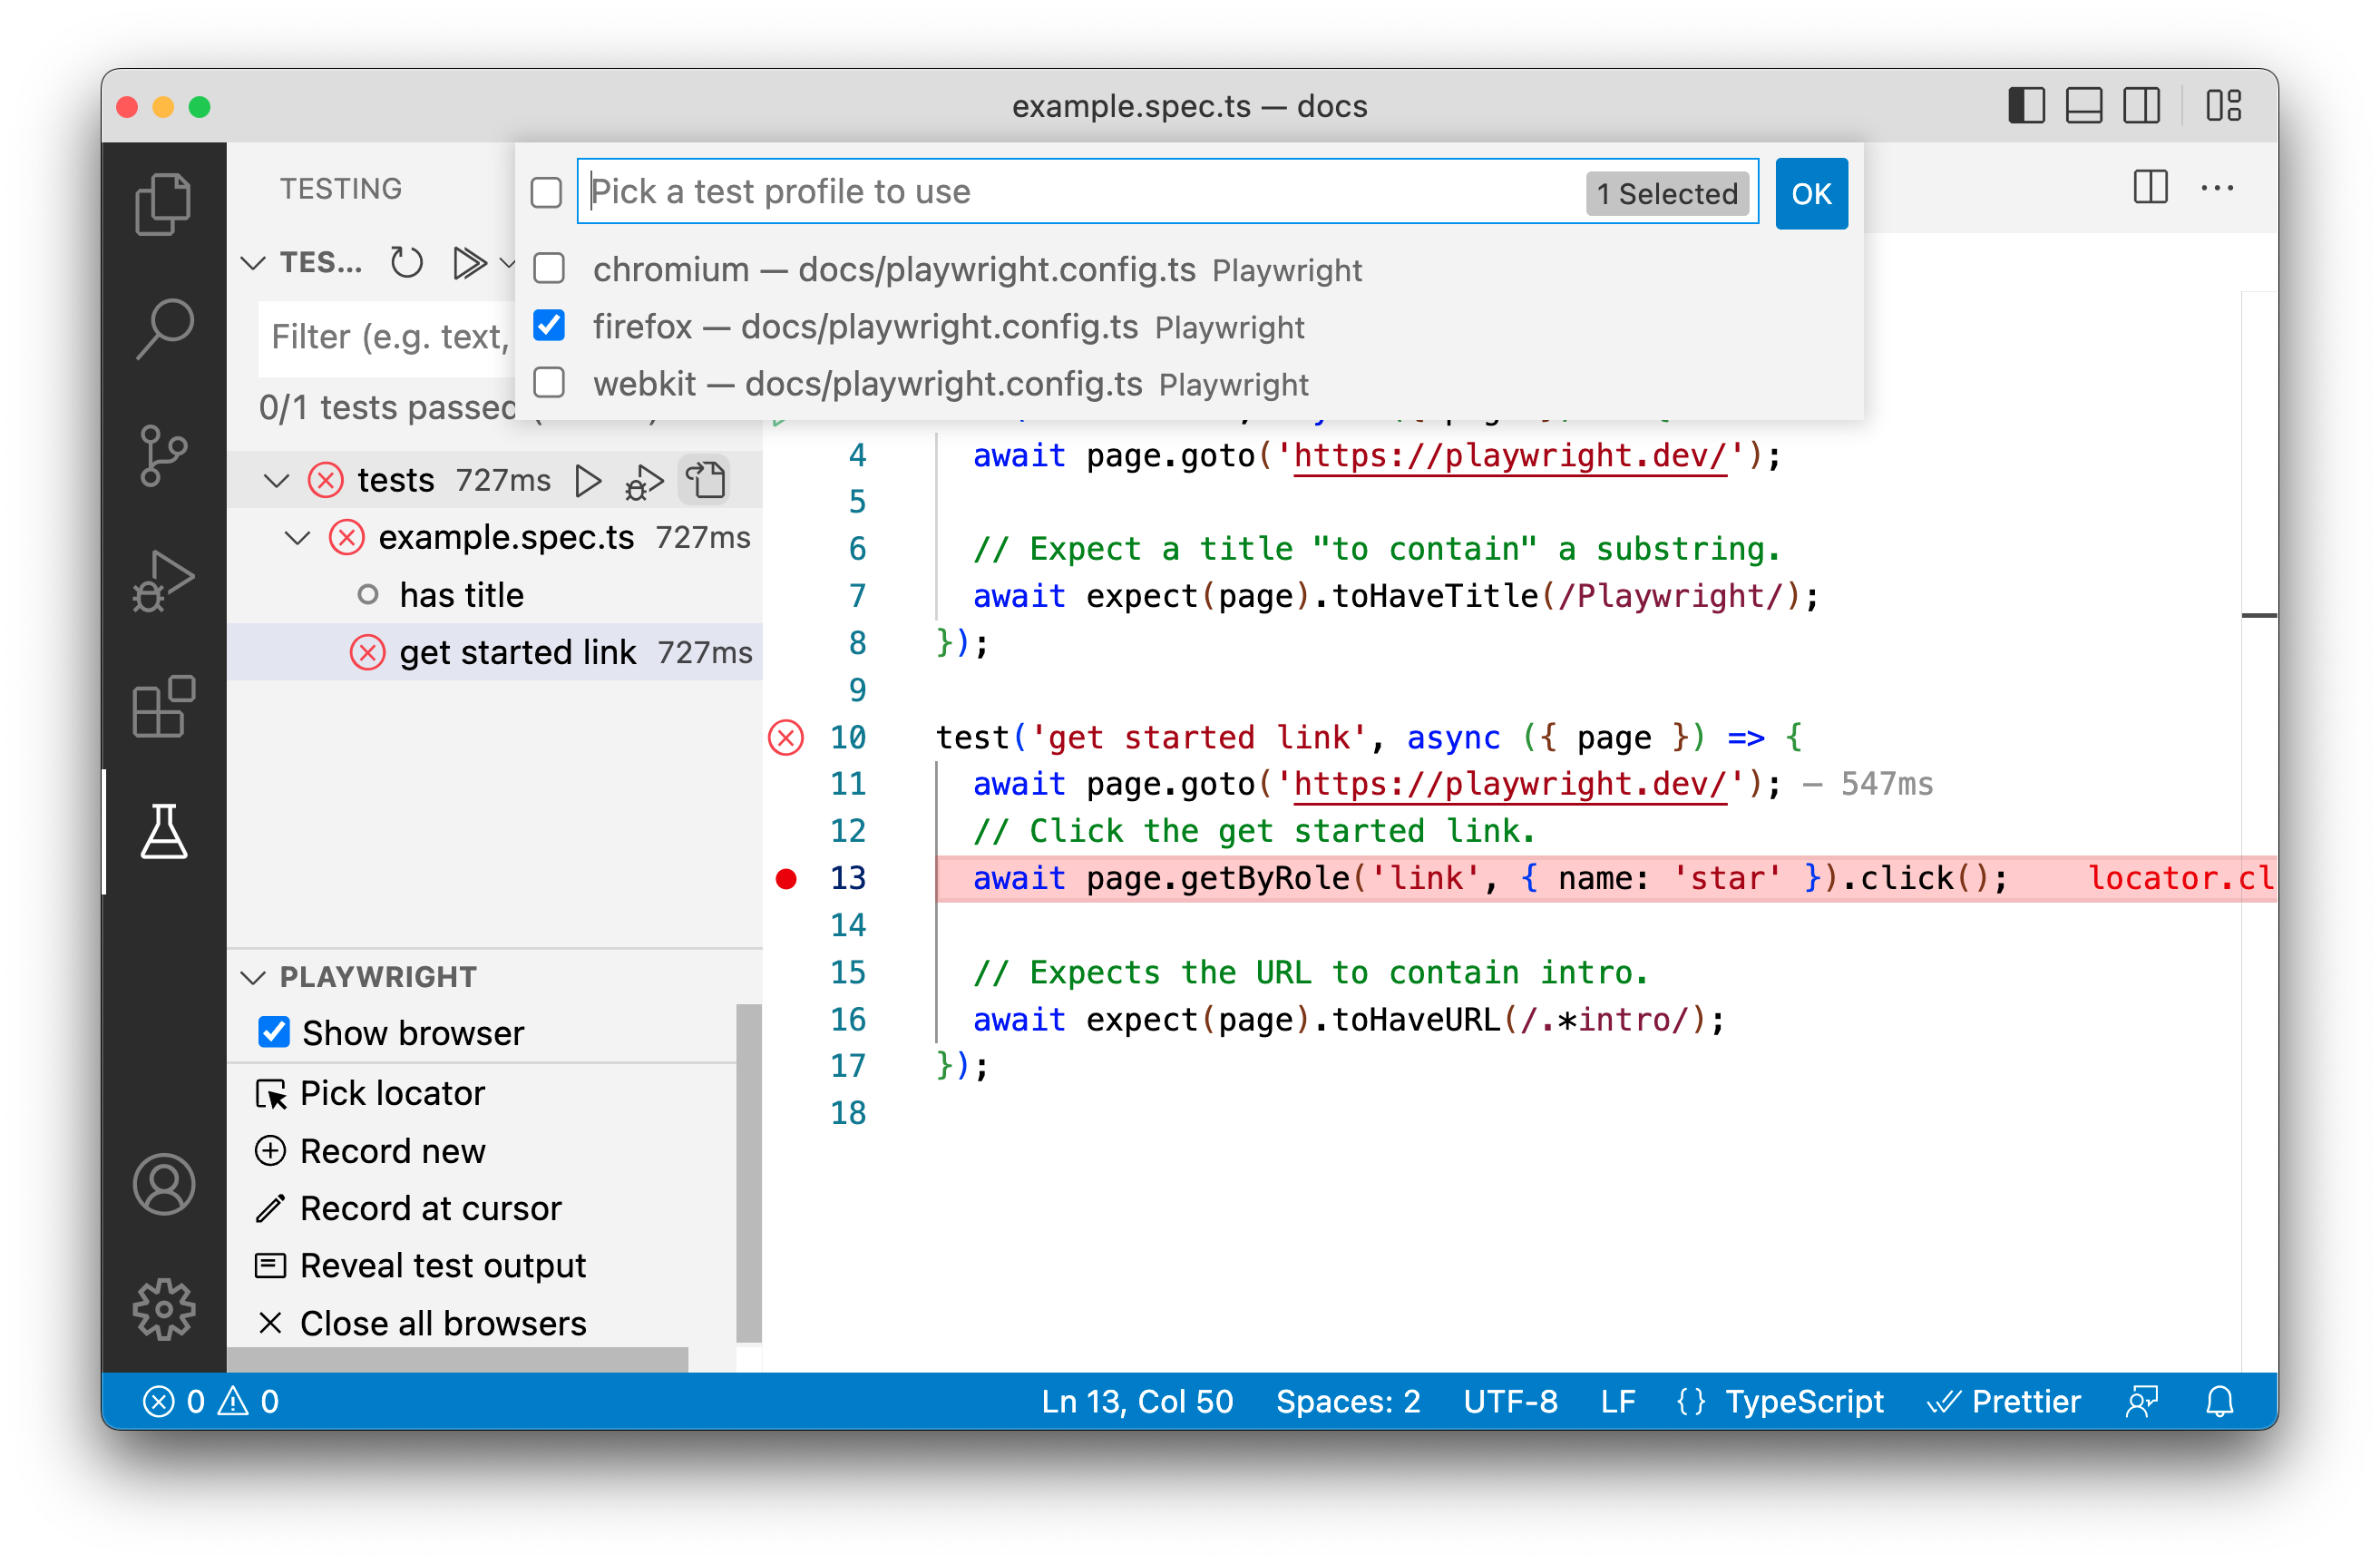
By default debugging is done using the Chromium profile. You can debug your tests on different browsers by right clicking on the debug icon in the testing sidebar and clicking on the 'Select Default Profile' option from the dropdown.
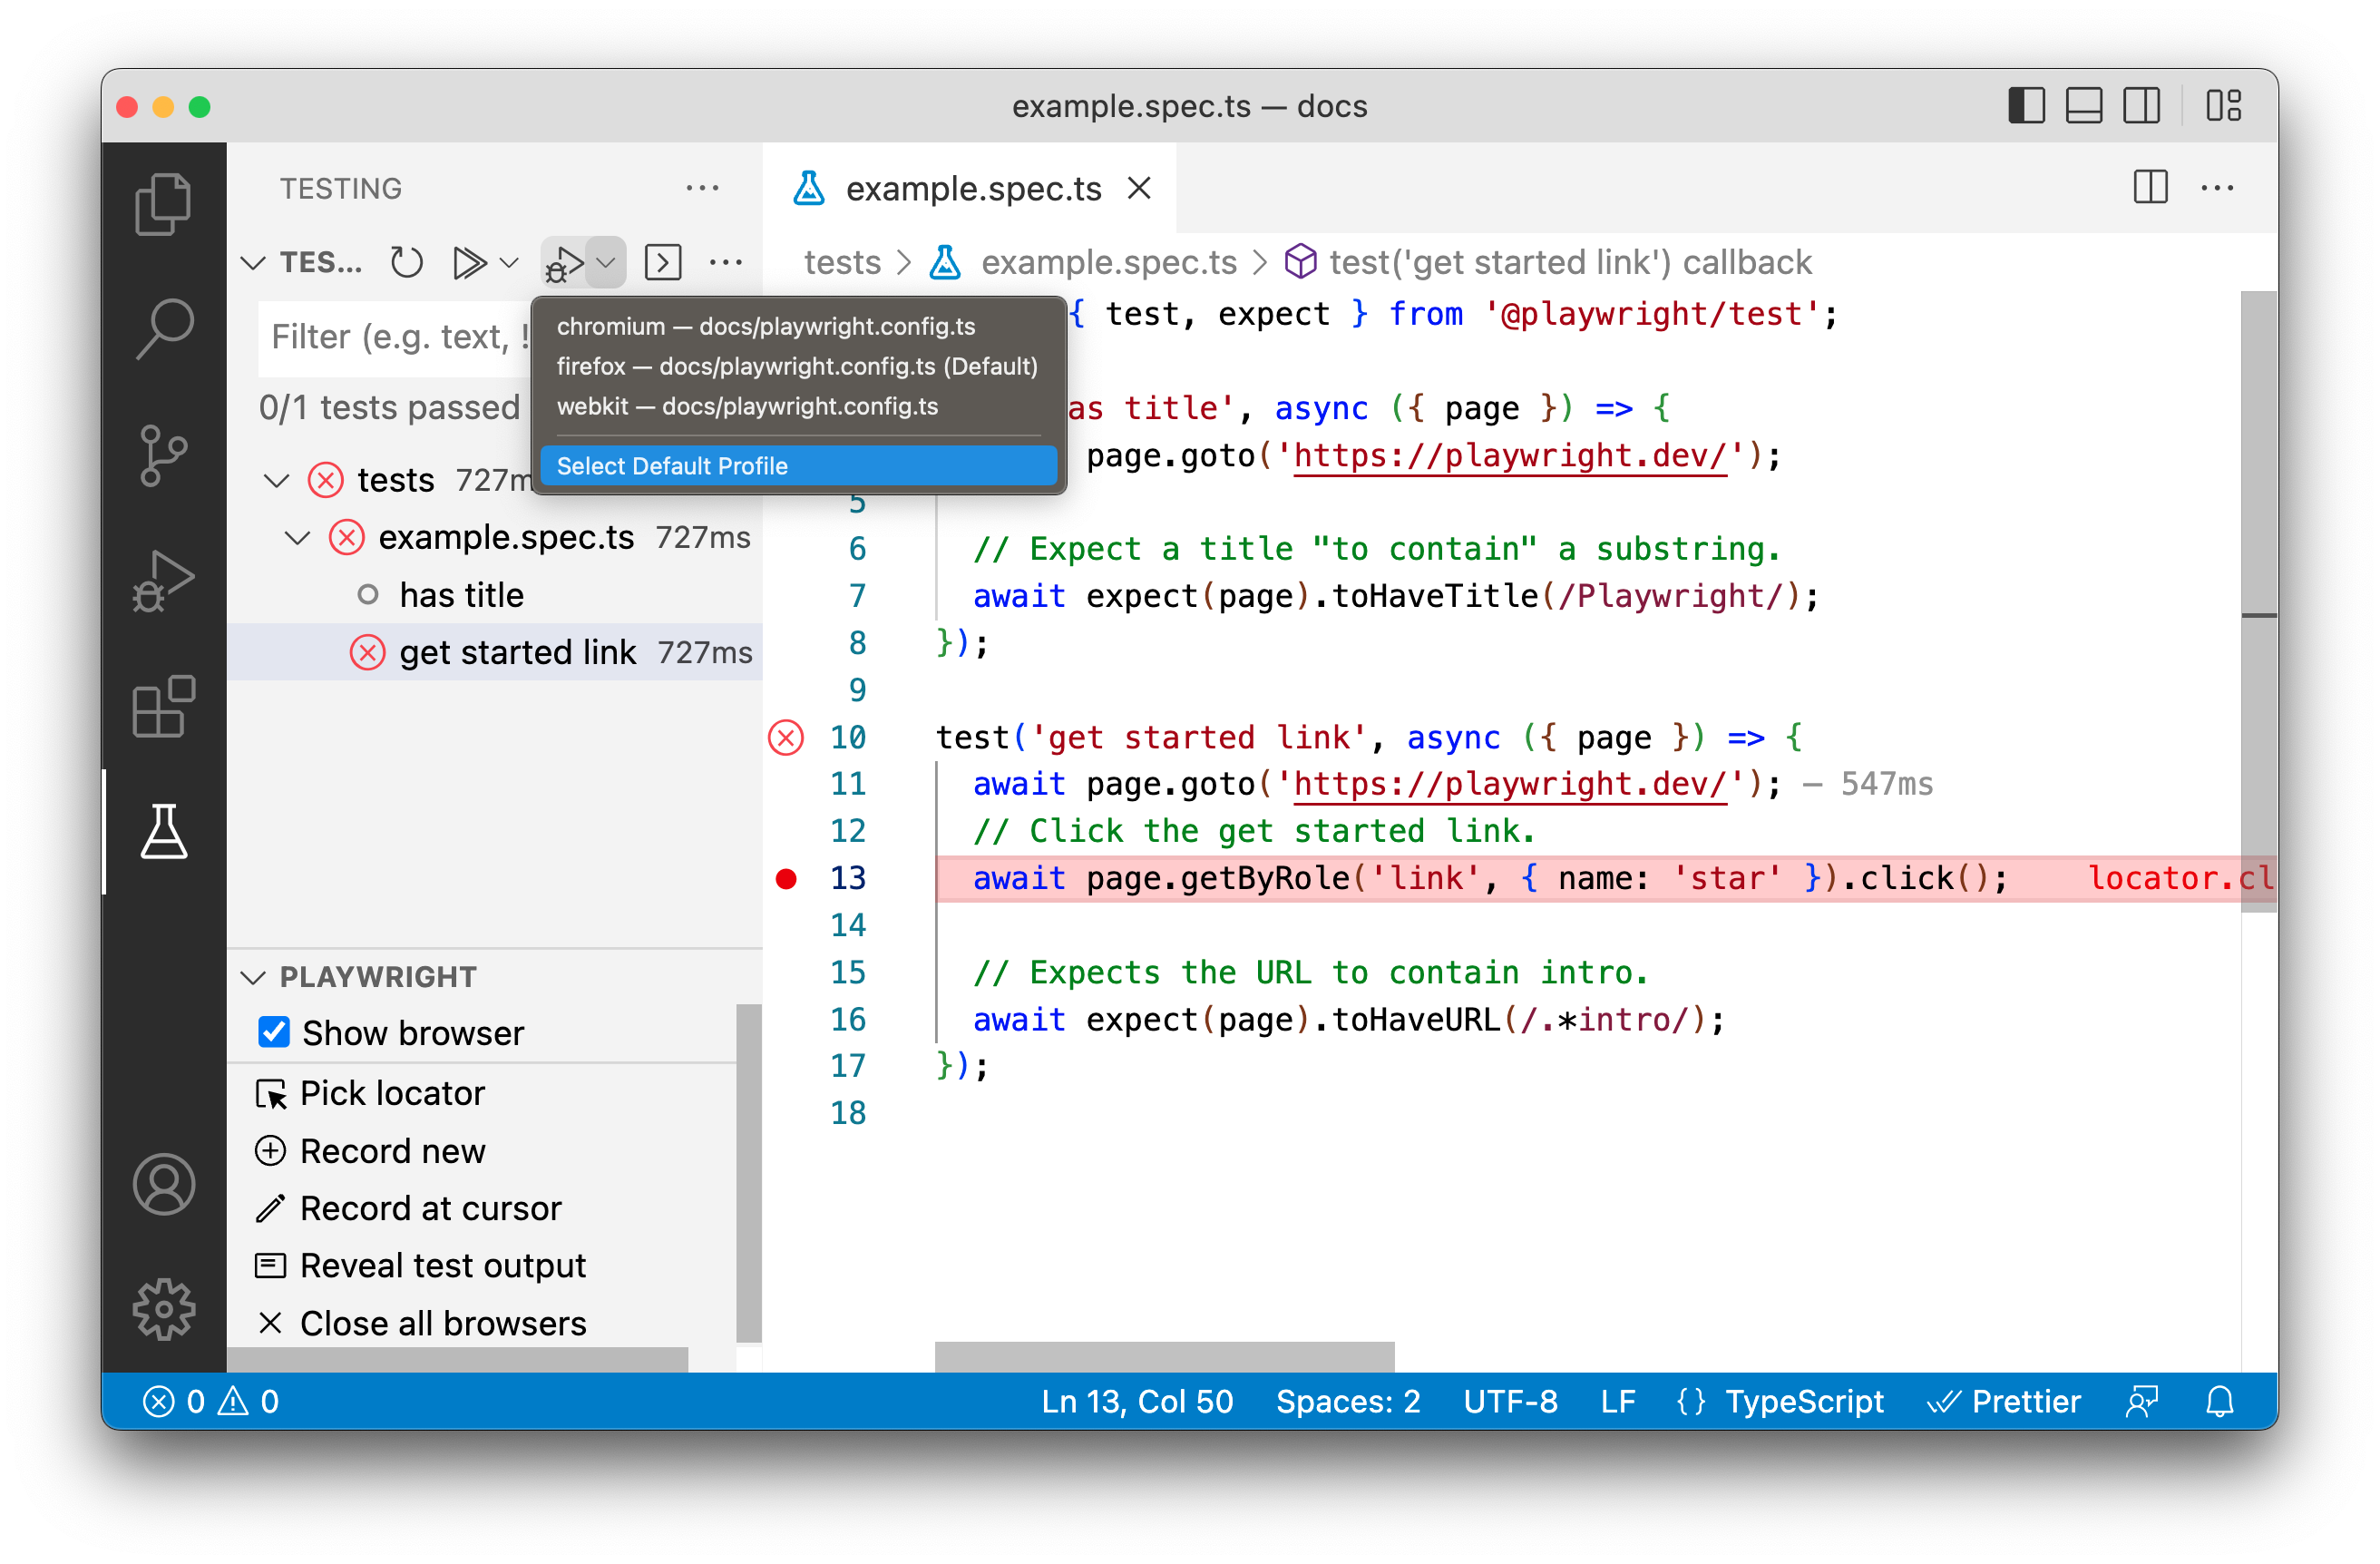
Then choose the test profile you would like to use for debugging your tests. Each time you run your test in debug mode it will use the profile you selected. You can run tests in debug mode by right clicking the line number where your test is and selecting 'Debug Test' from the menu.
To learn more about debugging, see Debugging in Visual Studio Code.
Playwright Inspector
The Playwright Inspector is a GUI tool to help you debug your Playwright tests. It allows you to step through your tests, live edit locators, pick locators and see actionability logs.
Run in debug mode
Run your tests with the --debug flag to open the inspector. This configures Playwright for debugging and opens the inspector. Additional useful defaults are configured when --debug is used:
- Browsers launch in headed mode
- Default timeout is set to 0 (= no timeout)
Debug all tests on all browsers
To debug all tests run the test command with the --debug flag. This will run tests one by one, and open the inspector and a browser window for each test.
npx playwright test --debug
Debug one test on all browsers
To debug one test on a specific line run the test command followed by the name of the test file and the line number of the test you want to debug, followed by the --debug flag. This will run a single test in each browser configured in your playwright.config and open the inspector.
npx playwright test example.spec.ts:10 --debug
Debug on a specific browser
In Playwright you can configure projects in your playwright.config. Once configured you can then debug your tests on a specific browser or mobile viewport using the --project flag followed by the name of the project configured in your playwright.config.
npx playwright test --project=chromium --debug
npx playwright test --project="Mobile Safari" --debug
npx playwright test --project="Microsoft Edge" --debug
Debug one test on a specific browser
To run one test on a specific browser add the name of the test file and the line number of the test you want to debug as well as the --project flag followed by the name of the project.
npx playwright test example.spec.ts:10 --project=webkit --debug
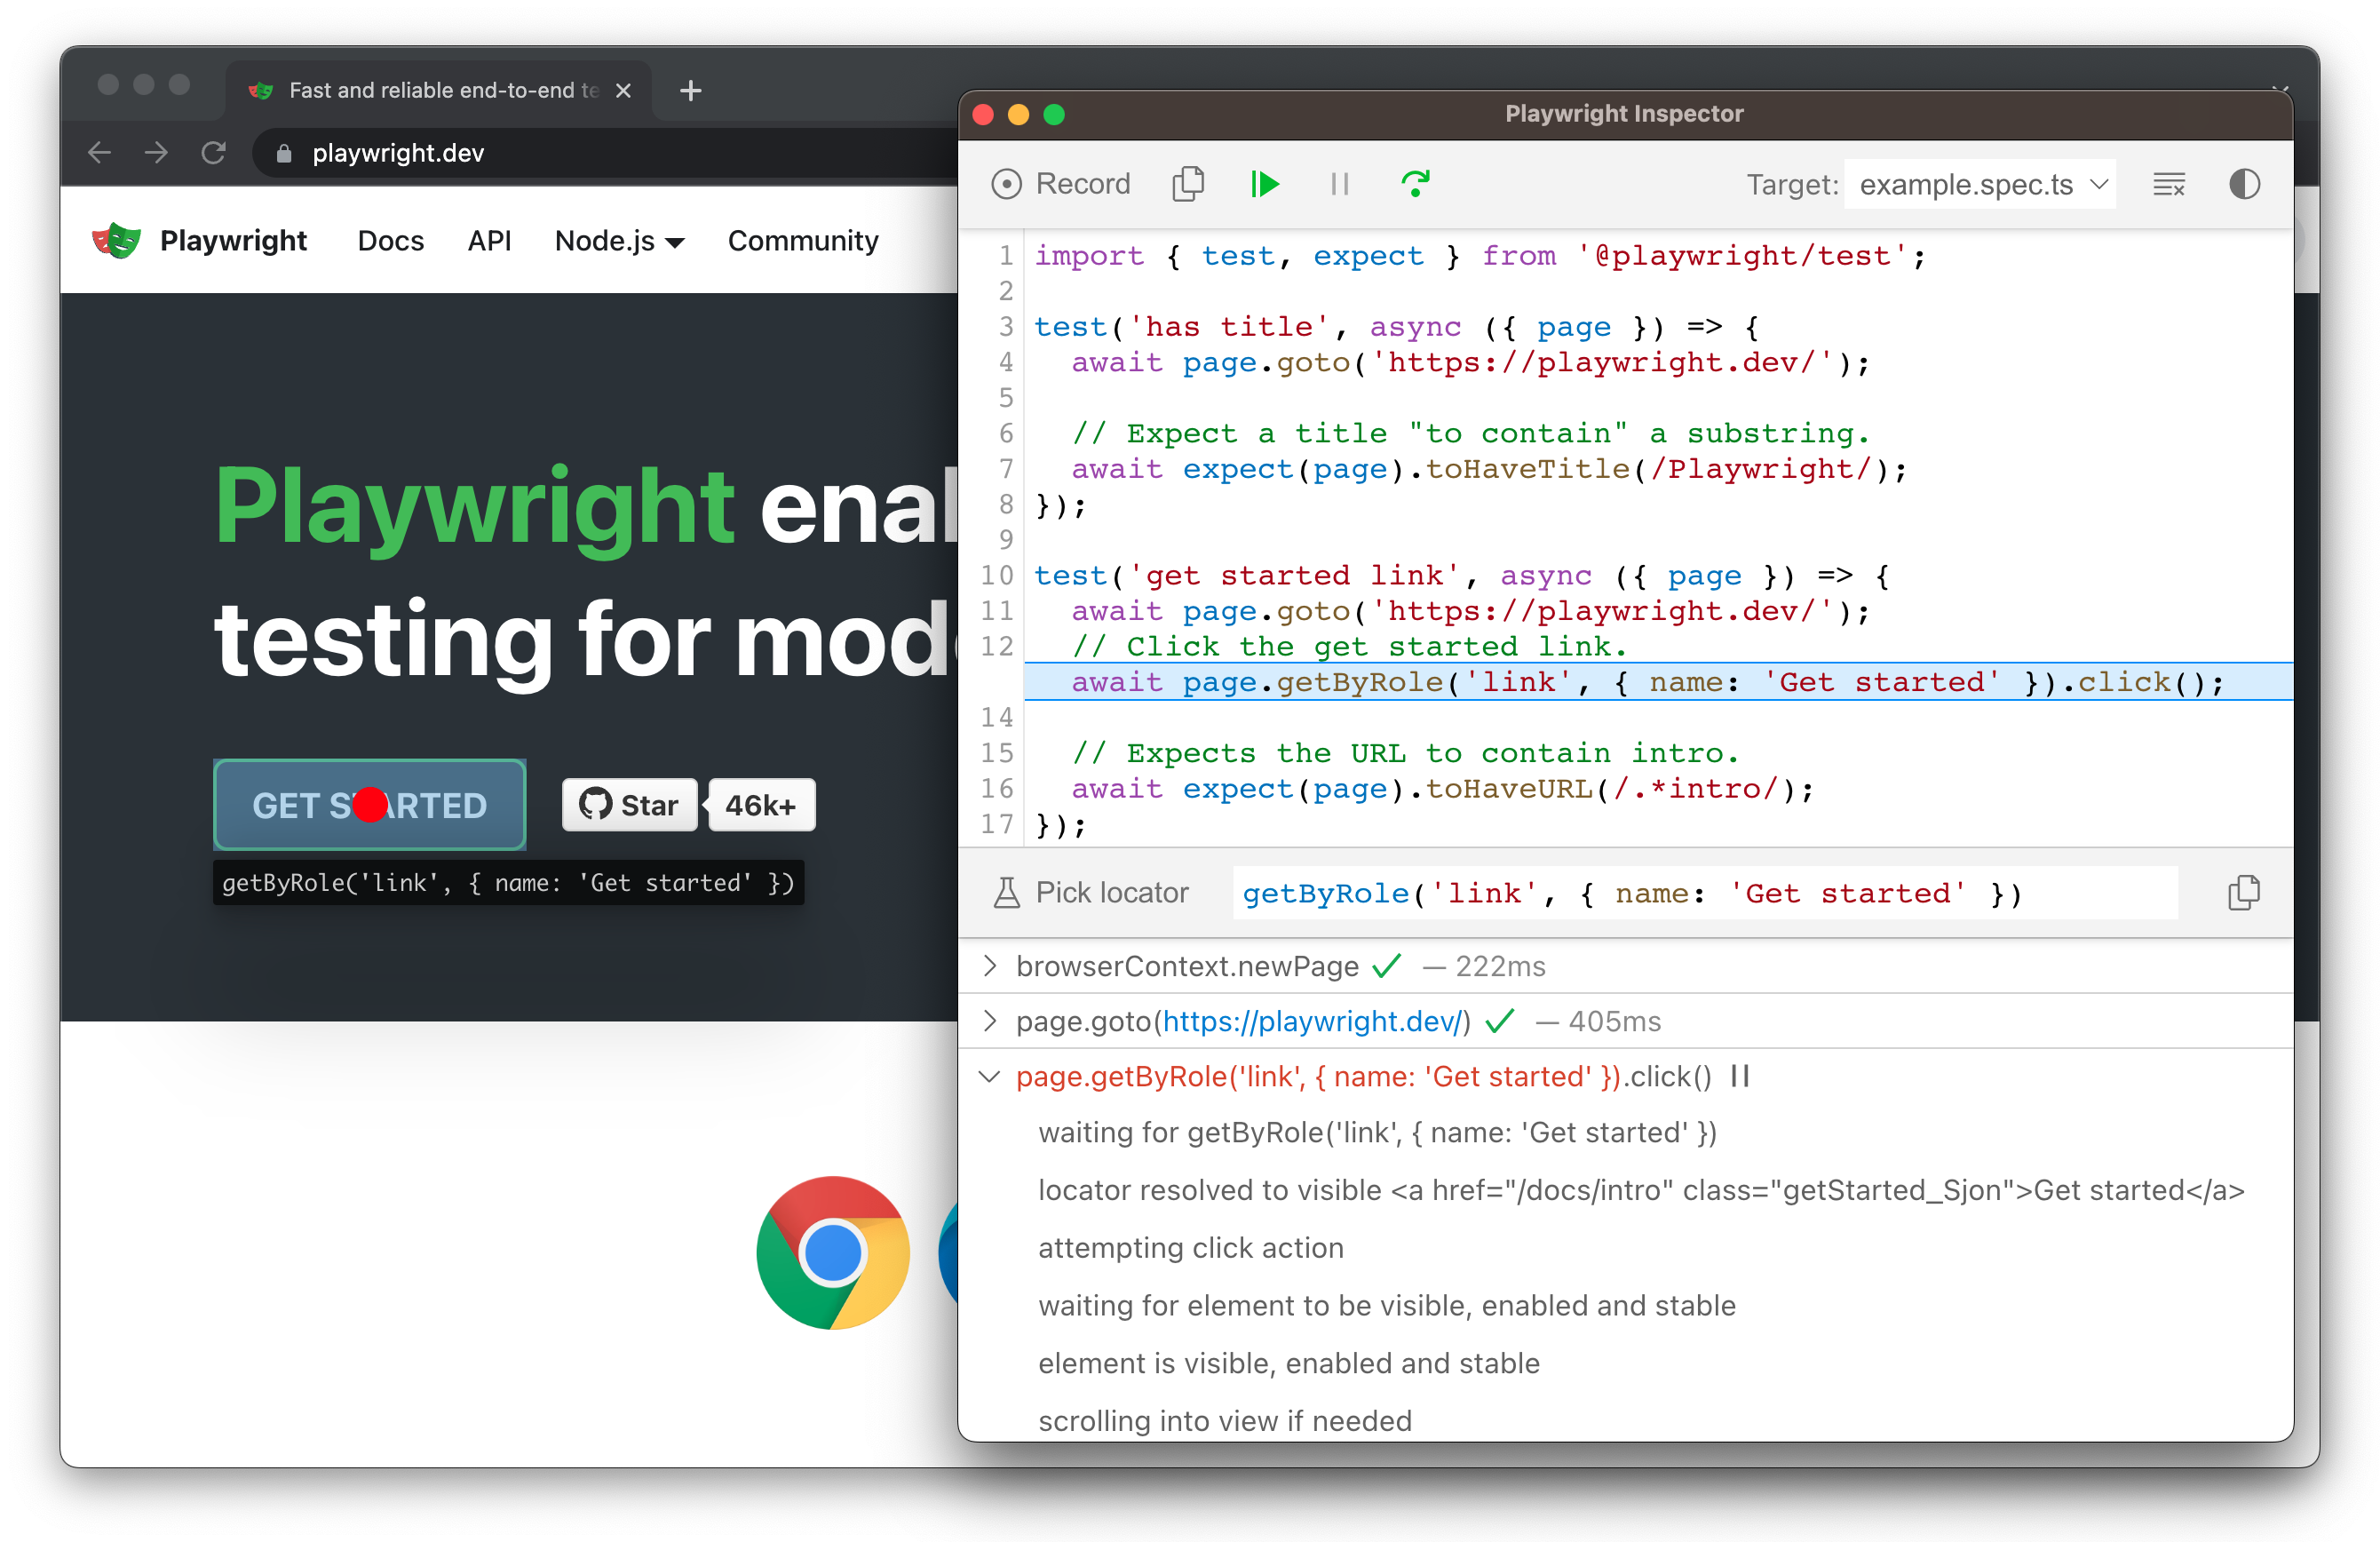
Stepping through your tests
You can play, pause or step through each action of your test using the toolbar at the top of the Inspector. You can see the current action highlighted in the test code, and matching elements highlighted in the browser window.
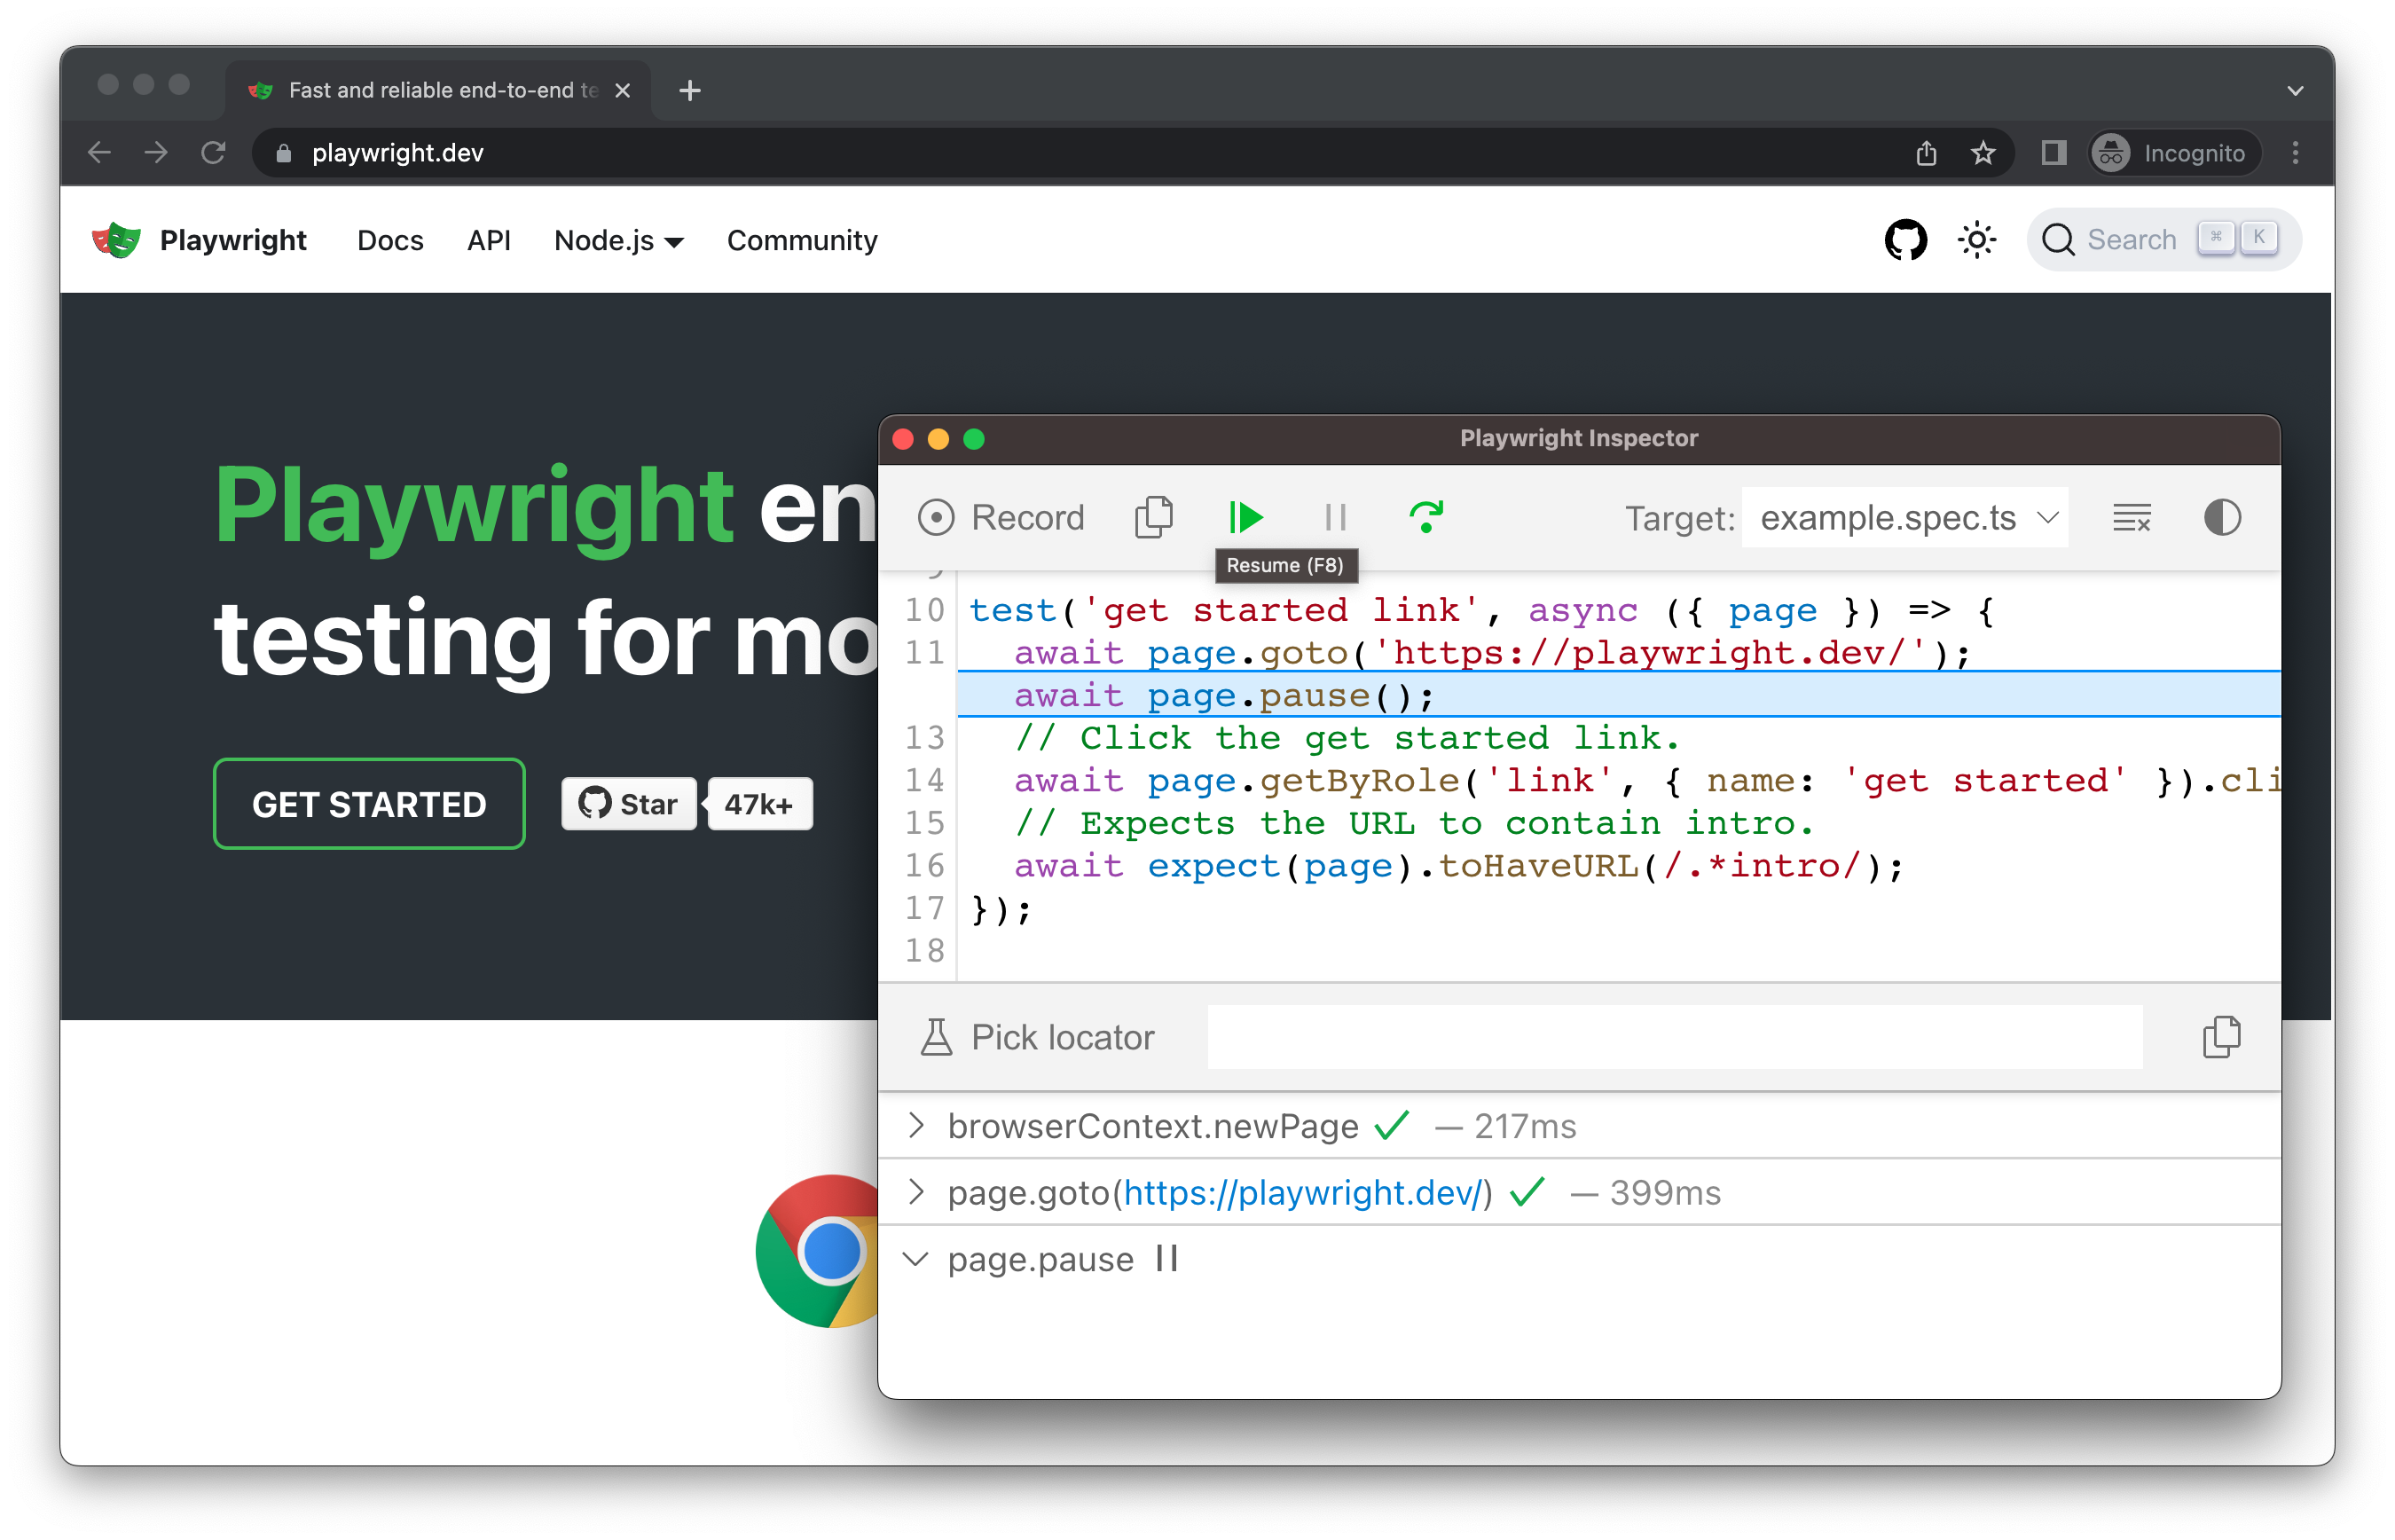
Run a test from a specific breakpoint
To speed up the debugging process you can add a page.pause() method to your test. This way you won't have to step through each action of your test to get to the point where you want to debug.
await page.pause();
Once you add a page.pause() call, run your tests in debug mode. Clicking the "Resume" button in the Inspector will run the test and only stop on the page.pause().
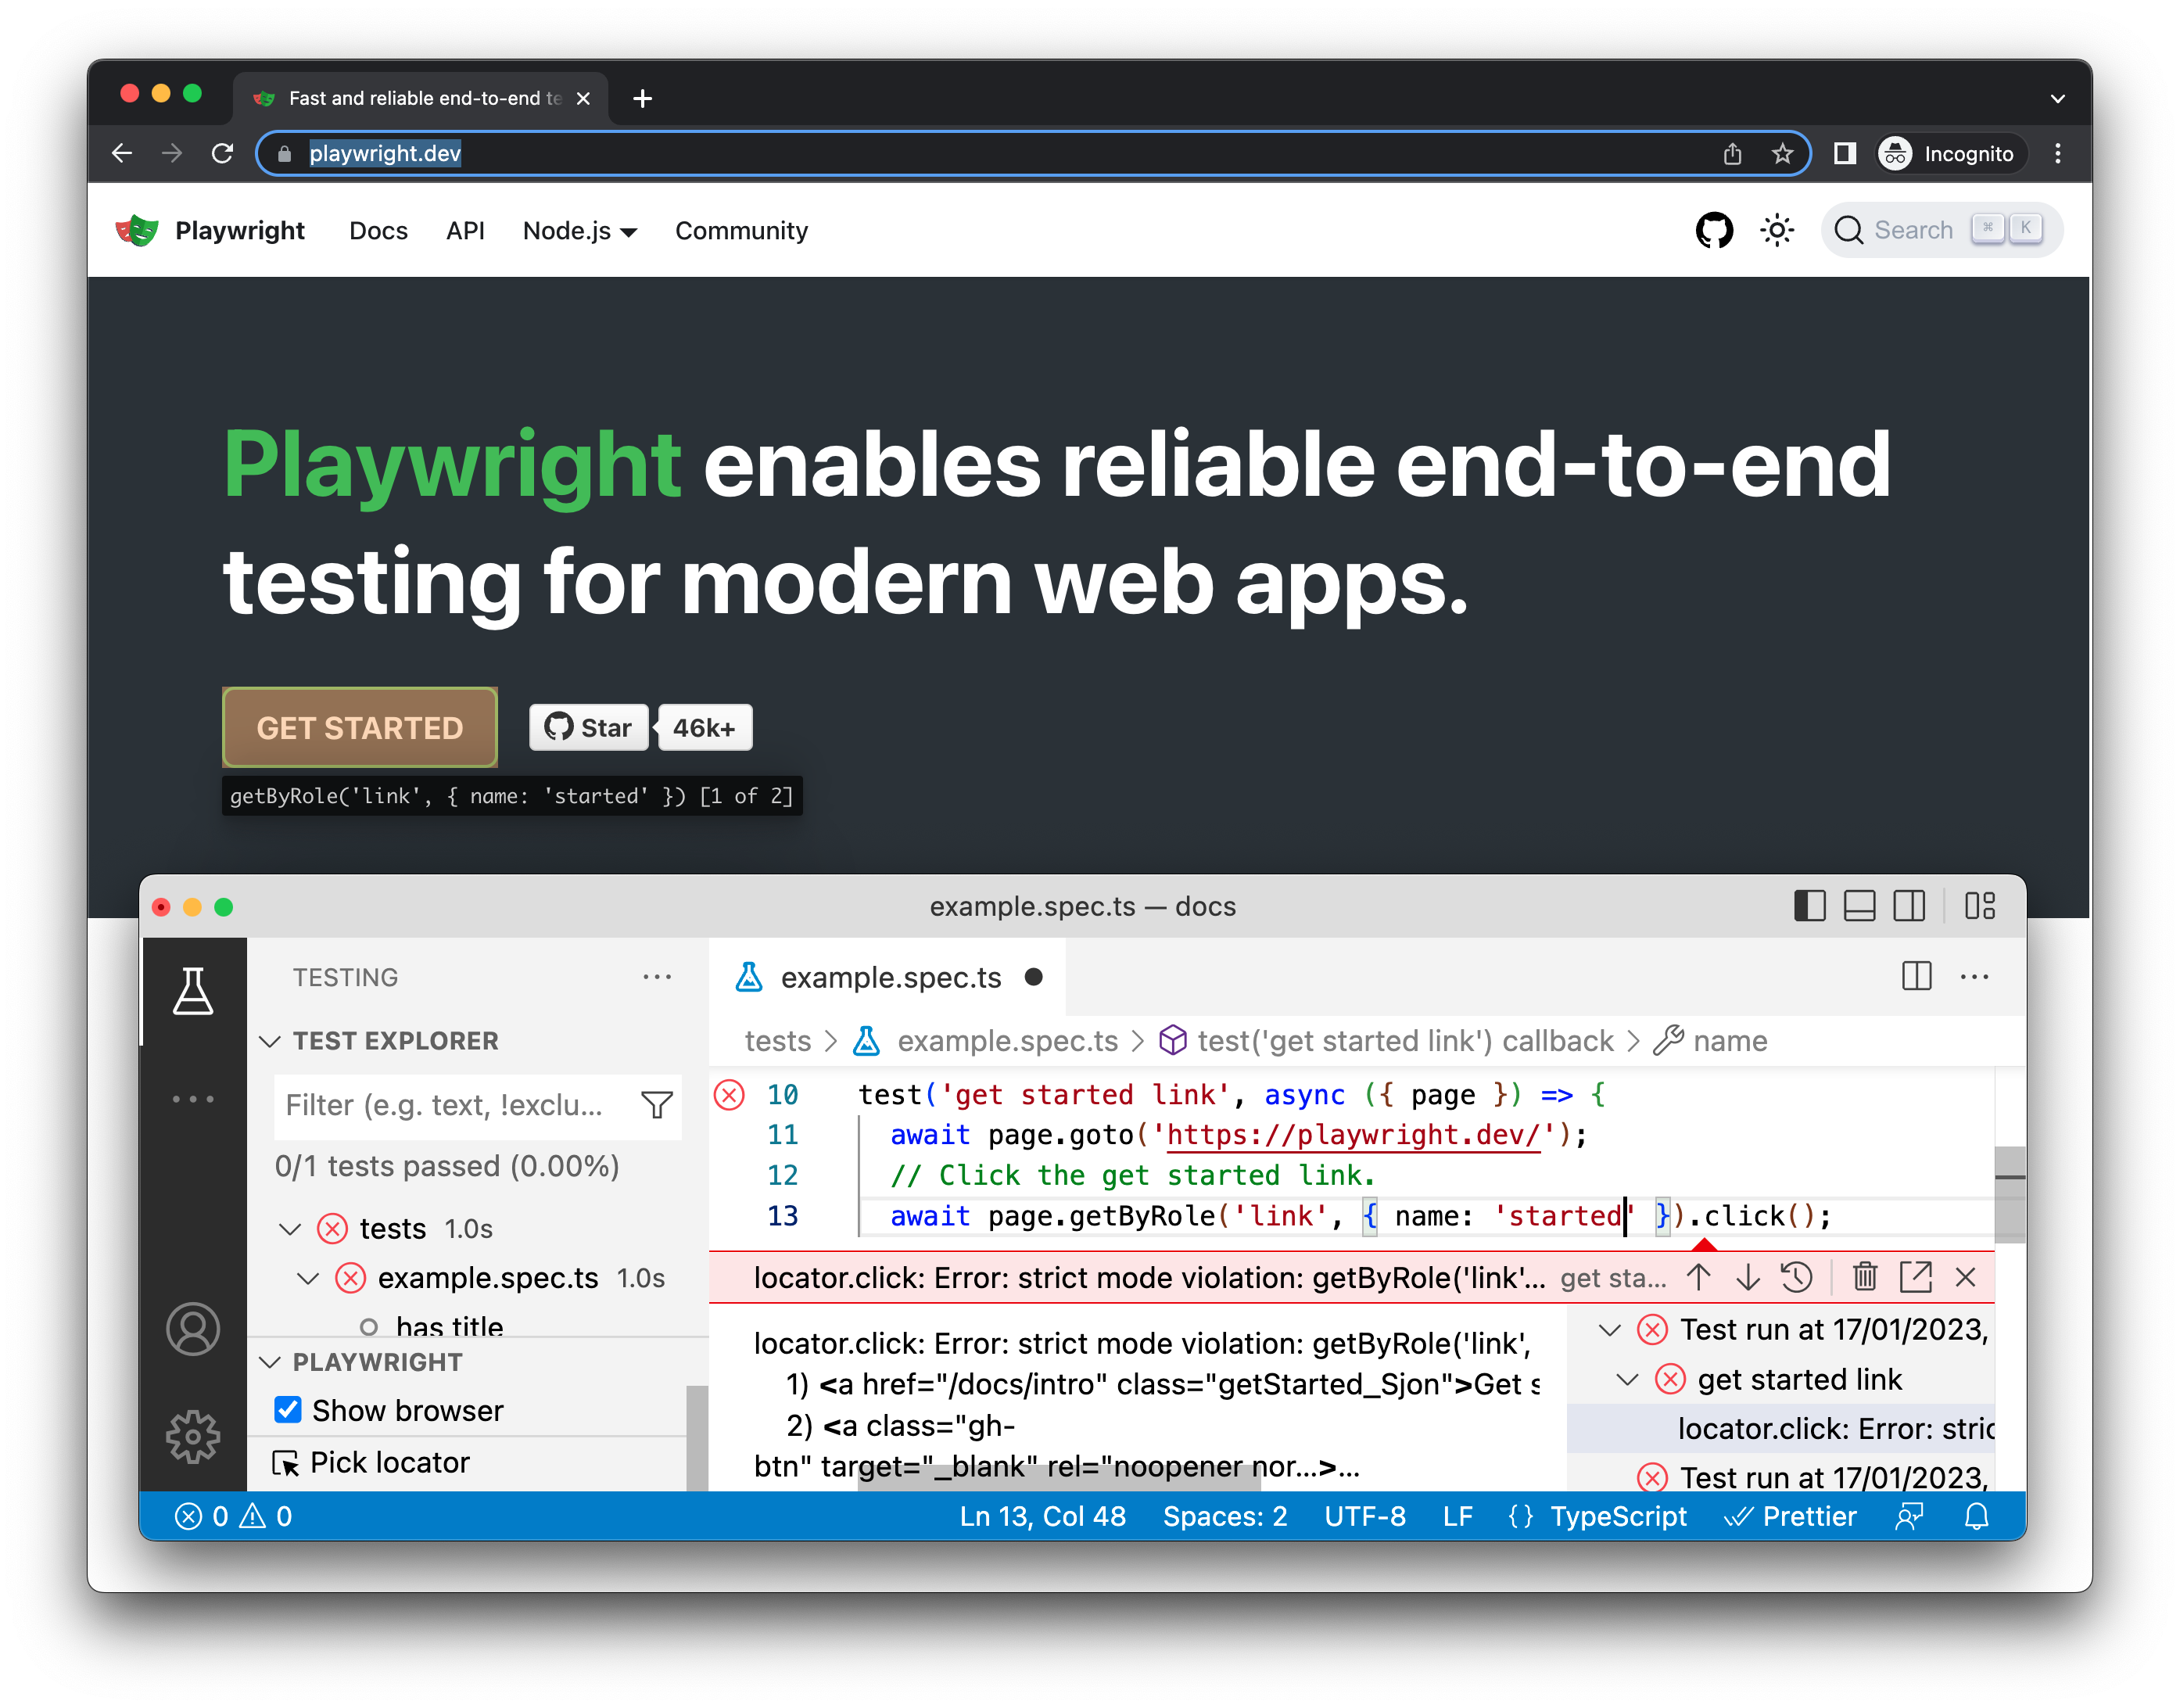
Live editing locators
While running in debug mode you can live edit the locators. Next to the 'Pick Locator' button there is a field showing the locator that the test is paused on. You can edit this locator directly in the Pick Locator field, and matching elements will be highlighted in the browser window.
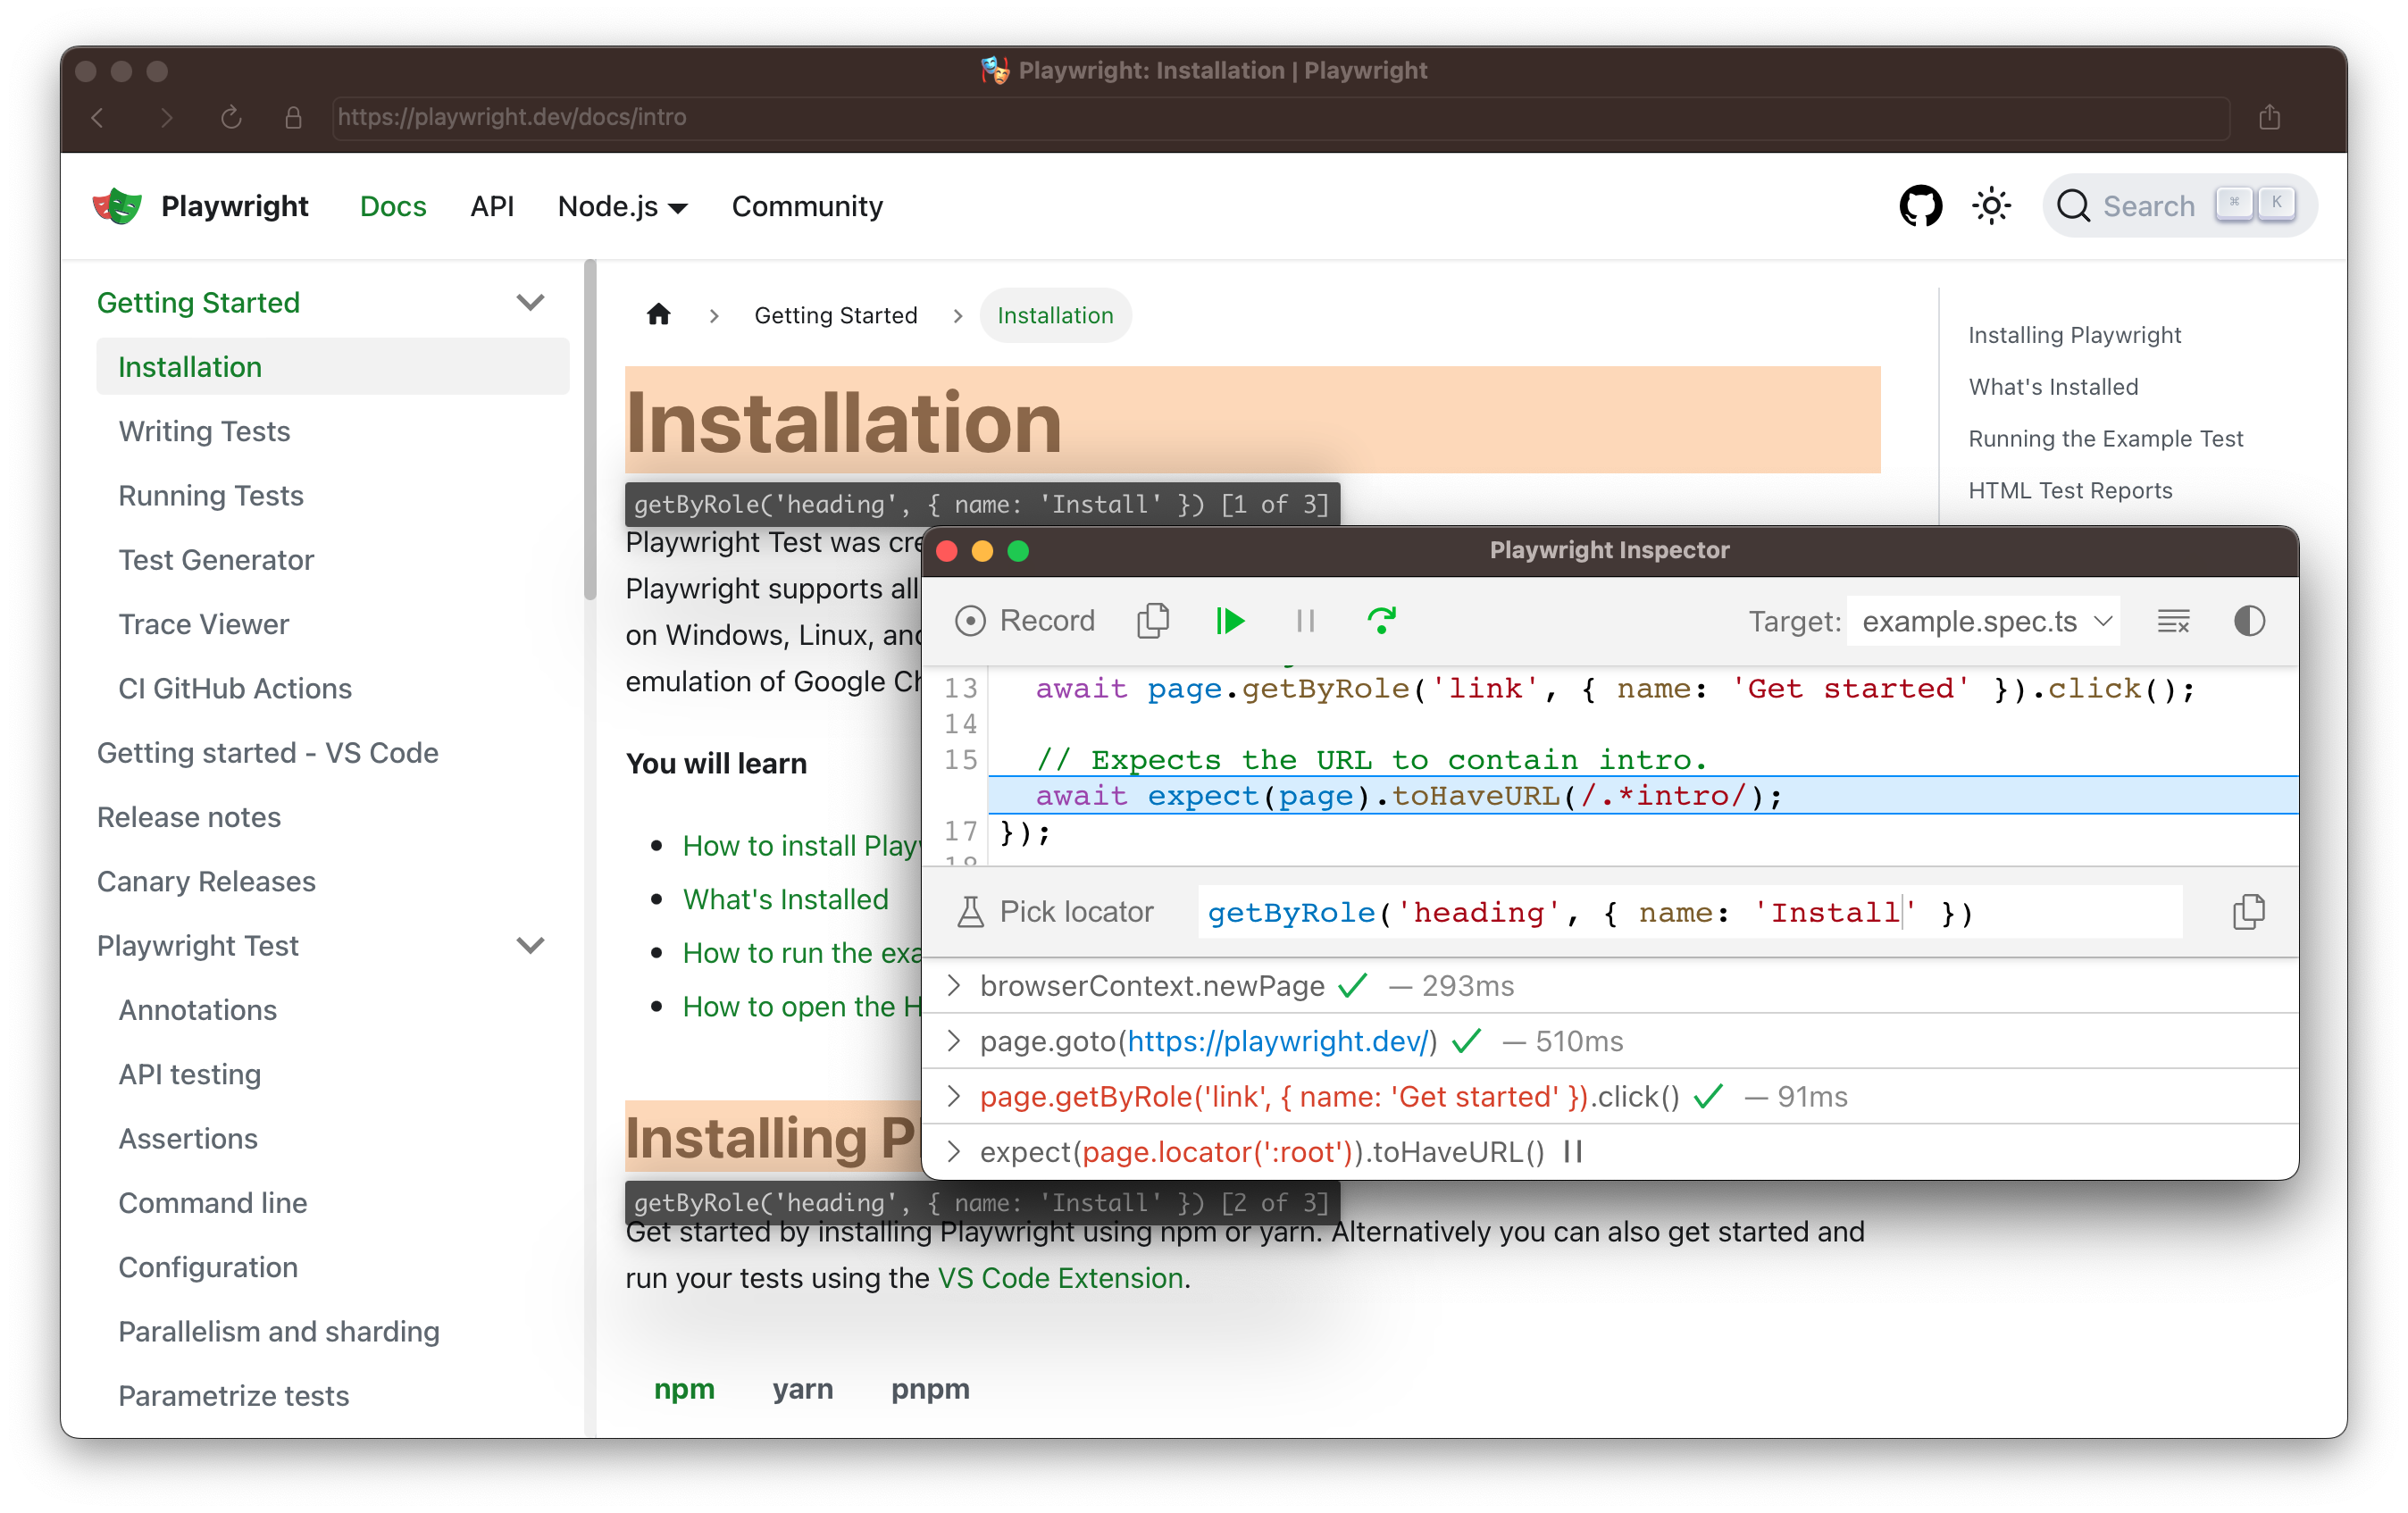
Picking locators
While debugging you might need to choose a more resilient locator. You can do this by clicking on the Pick Locator button and hovering over any element in the browser window. While hovering over an element you will see the code needed to locate this element highlighted below. Clicking an element in the browser will add the locator into the field where you can then either tweak it or copy it into your code.
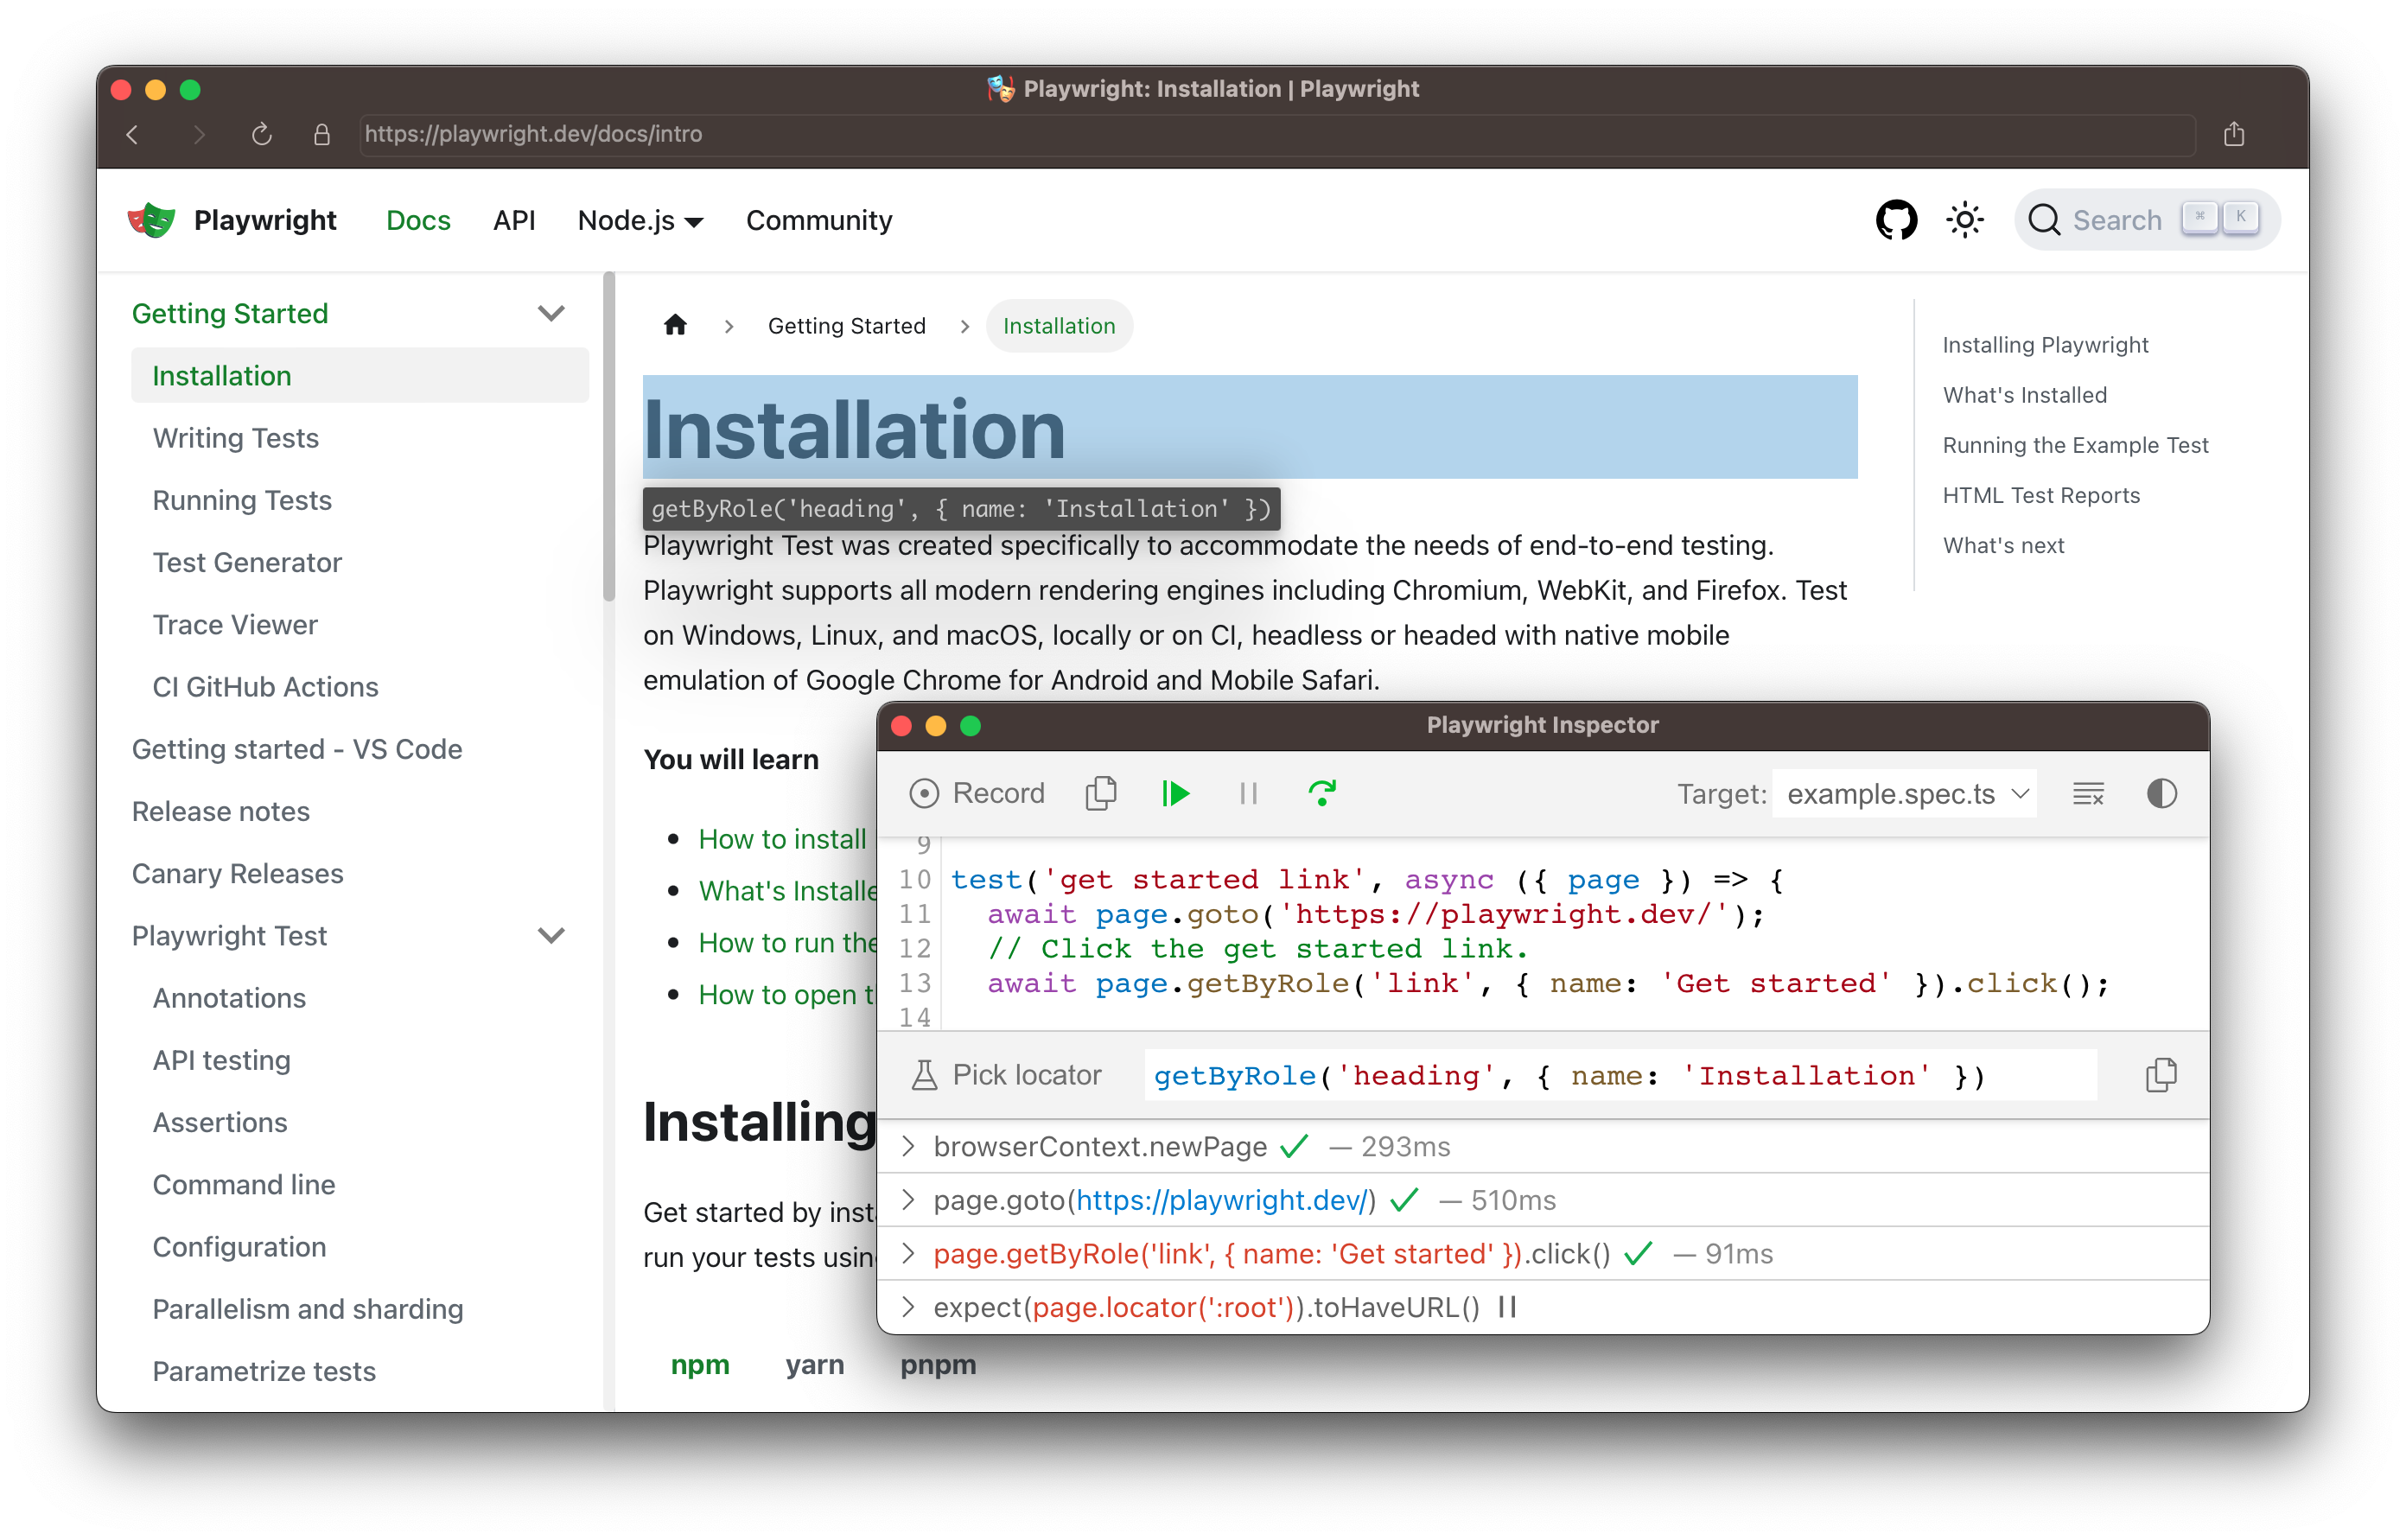
Playwright will look at your page and figure out the best locator, prioritizing role, text and test id locators. If Playwright finds multiple elements matching the locator, it will improve the locator to make it resilient and uniquely identify the target element, so you don't have to worry about failing tests due to locators.
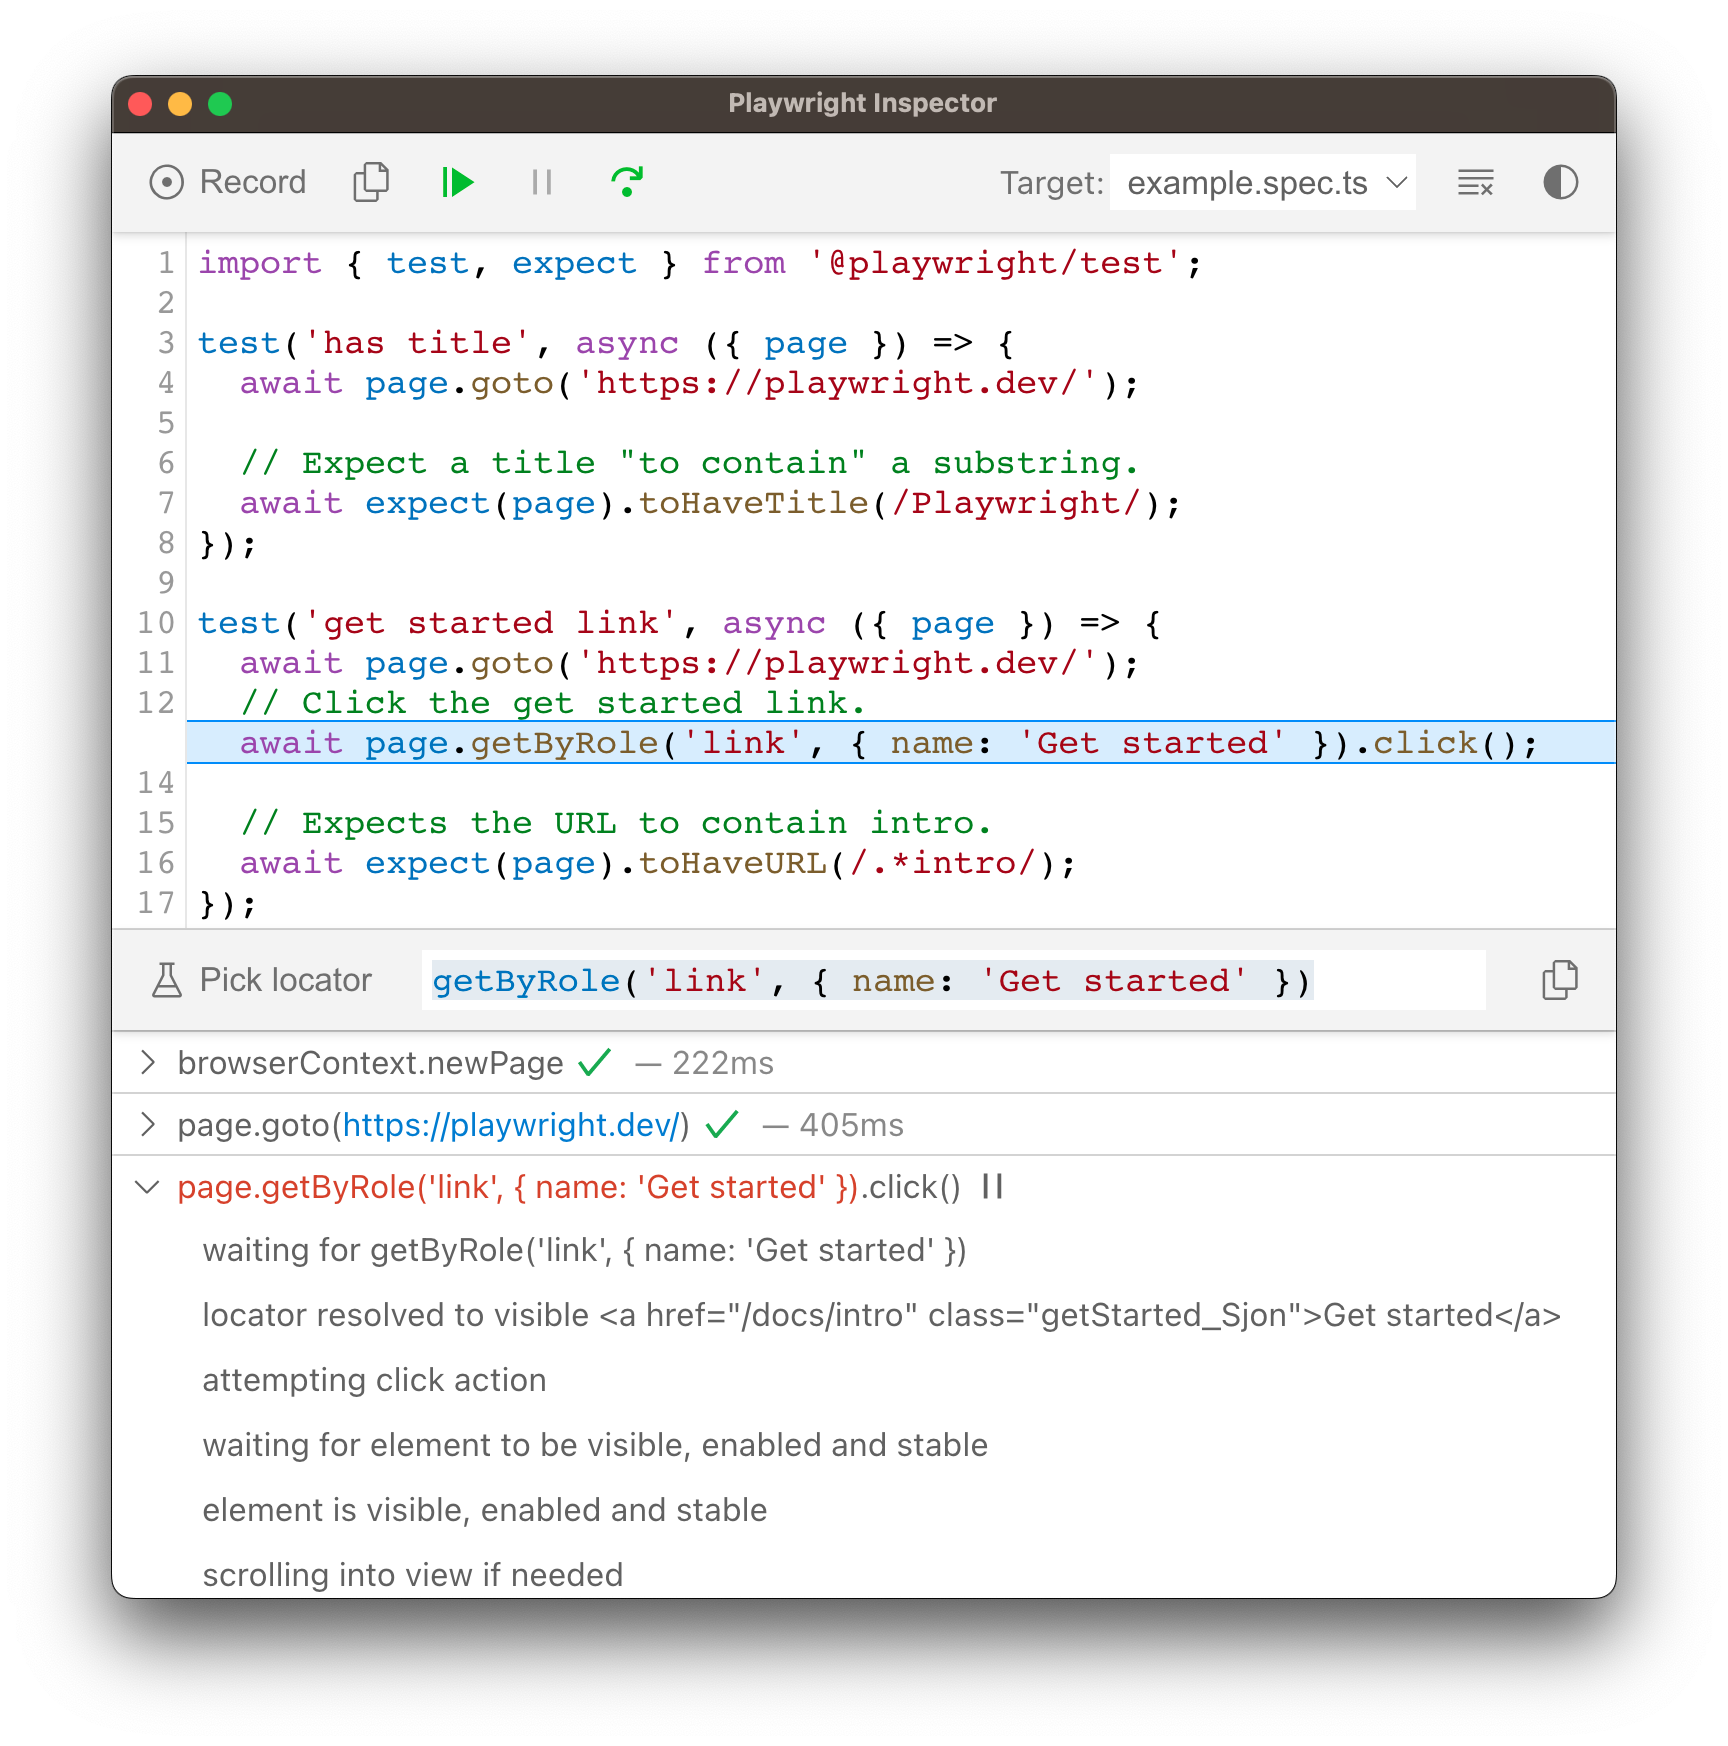
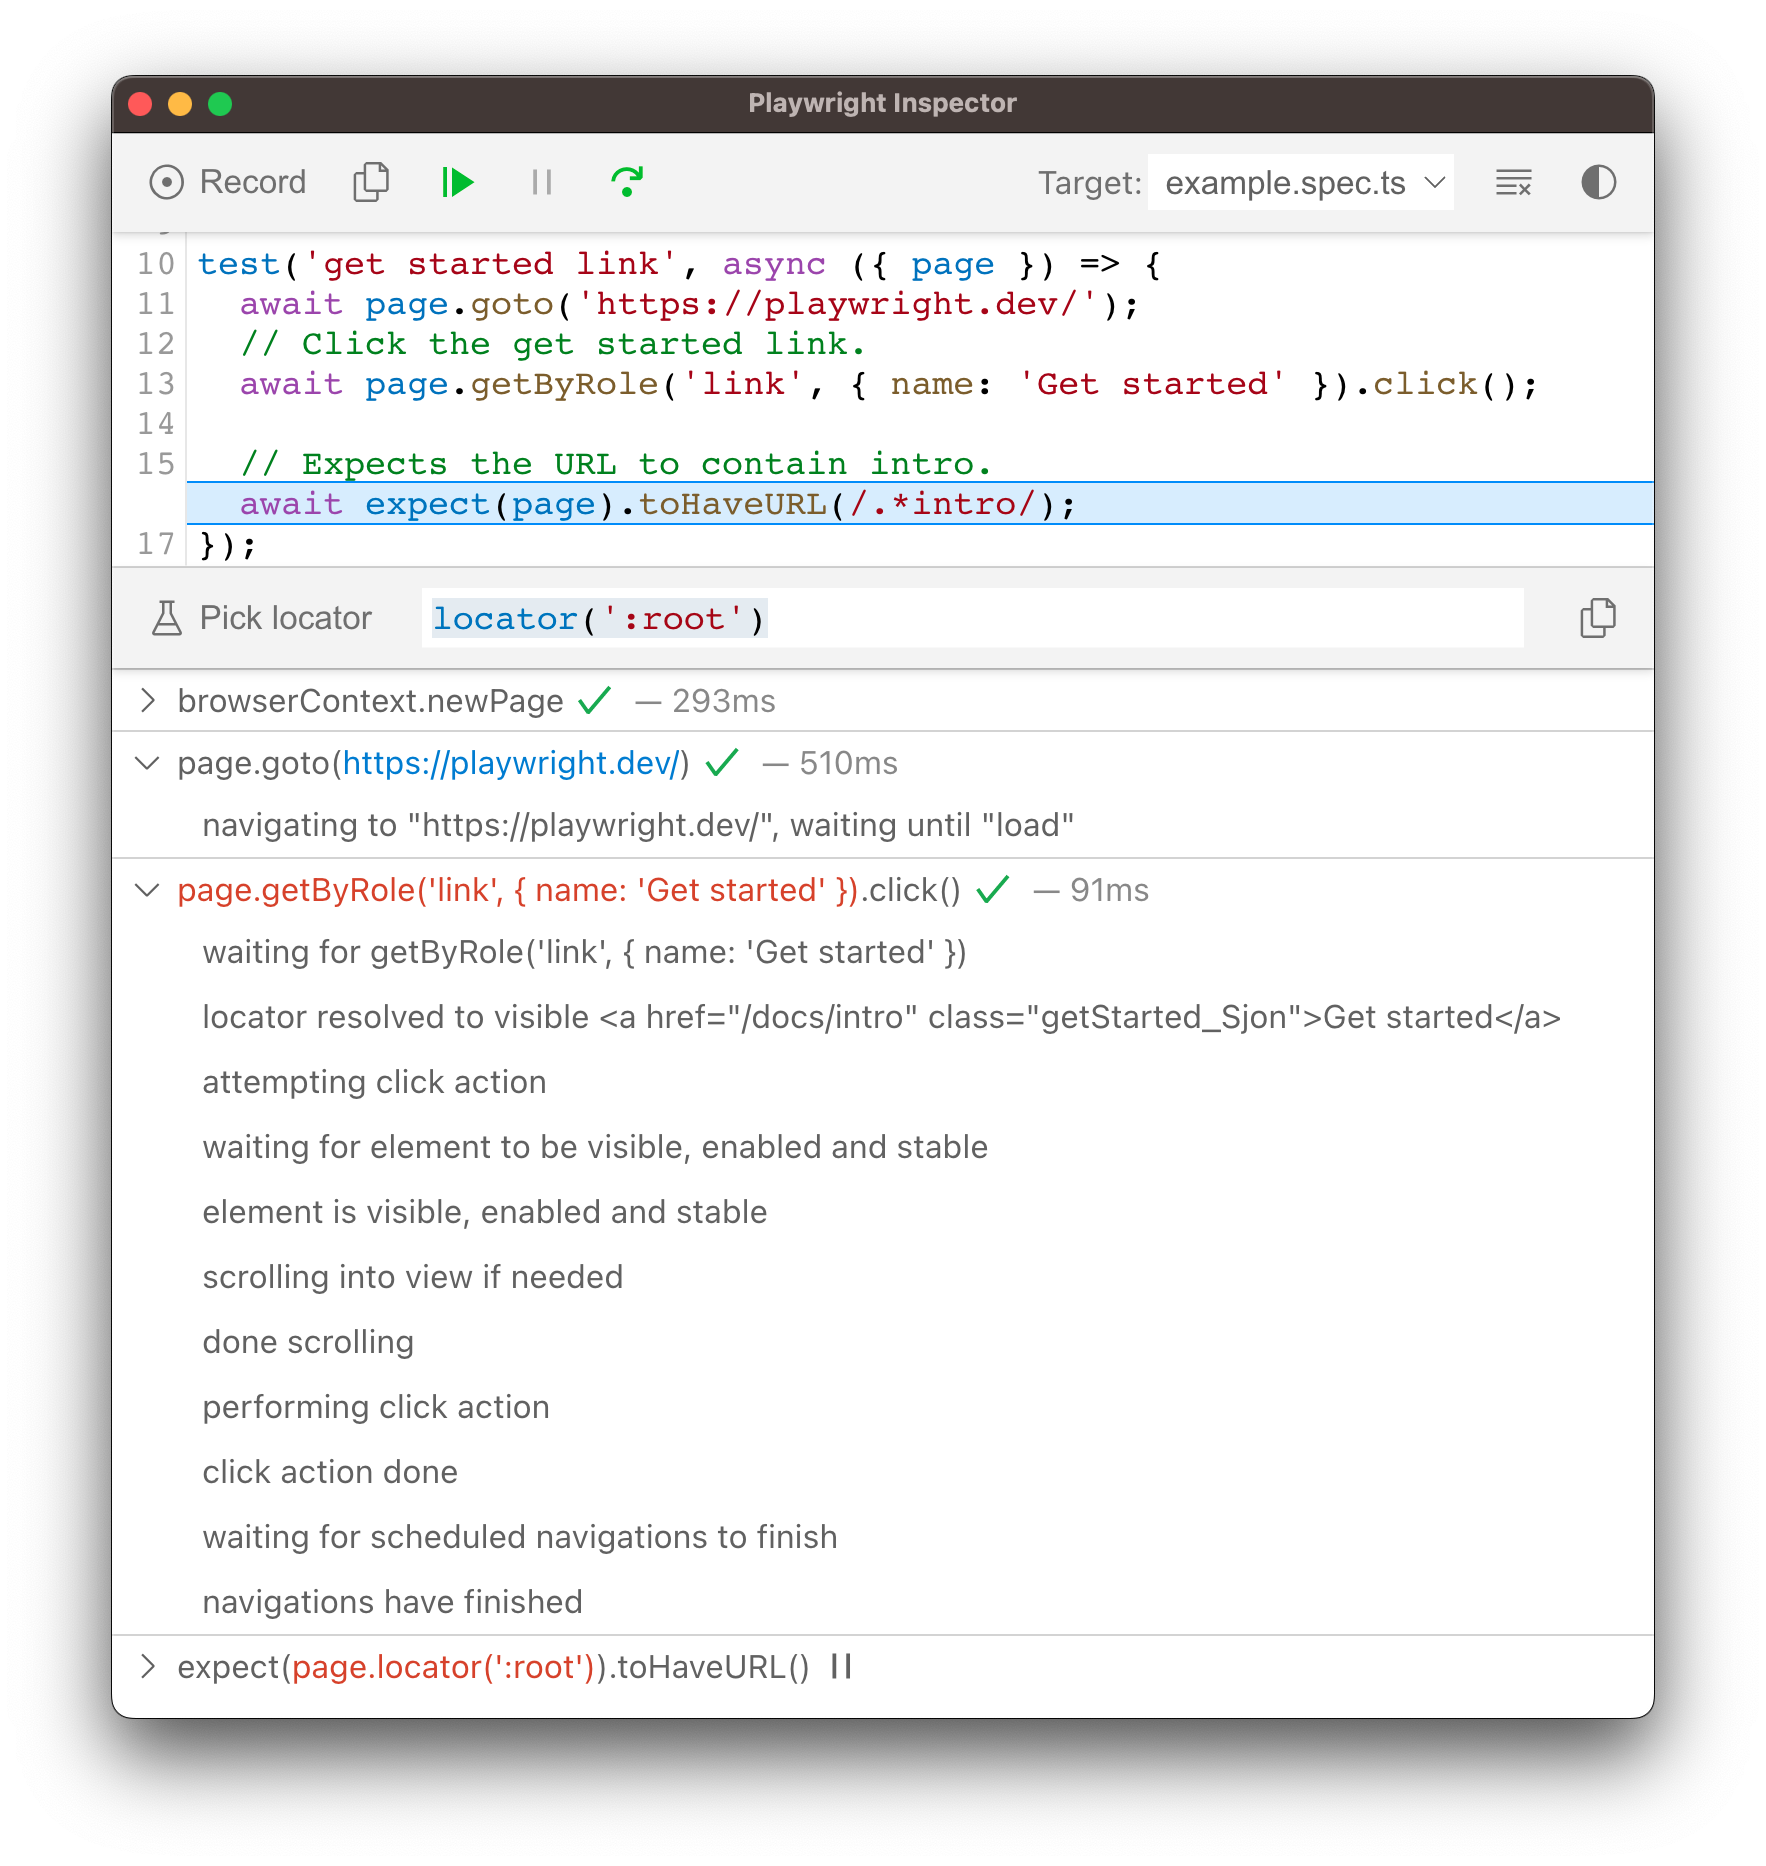
Actionability logs
By the time Playwright has paused on a click action, it has already performed actionability checks that can be found in the log. This can help you understand what happened during your test and what Playwright did or tried to do. The log tells you if the element was visible, enabled and stable, if the locator resolved to an element, scrolled into view, and so much more. If actionability can't be reached, it will show the action as pending.
Trace Viewer
Playwright Trace Viewer is a GUI tool that lets you explore recorded Playwright traces of your tests. You can go back and forward through each action on the left side, and visually see what was happening during the action. In the middle of the screen, you can see a DOM snapshot for the action. On the right side you can see action details, such as time, parameters, return value and log. You can also explore console messages, network requests and the source code.
To learn more about how to record traces and use the Trace Viewer, check out the Trace Viewer guide.
Browser Developer Tools
When running in Debug Mode with PWDEBUG=console, a playwright object is available in the Developer tools console. Developer tools can help you to:
- Inspect the DOM tree and find element selectors
- See console logs during execution (or learn how to read logs via API)
- Check network activity and other developer tools features
This will also set the default timeouts of Playwright to 0 (= no timeout).
To debug your tests using the browser developer tools start by setting a breakpoint in your test to pause the execution using the page.pause() method.
await page.pause();
Once you have set a breakpoint in your test you can then run your test with PWDEBUG=console.
- Bash
- PowerShell
- Batch
PWDEBUG=console npx playwright test
$env:PWDEBUG="console"
npx playwright test
set PWDEBUG=console
npx playwright test
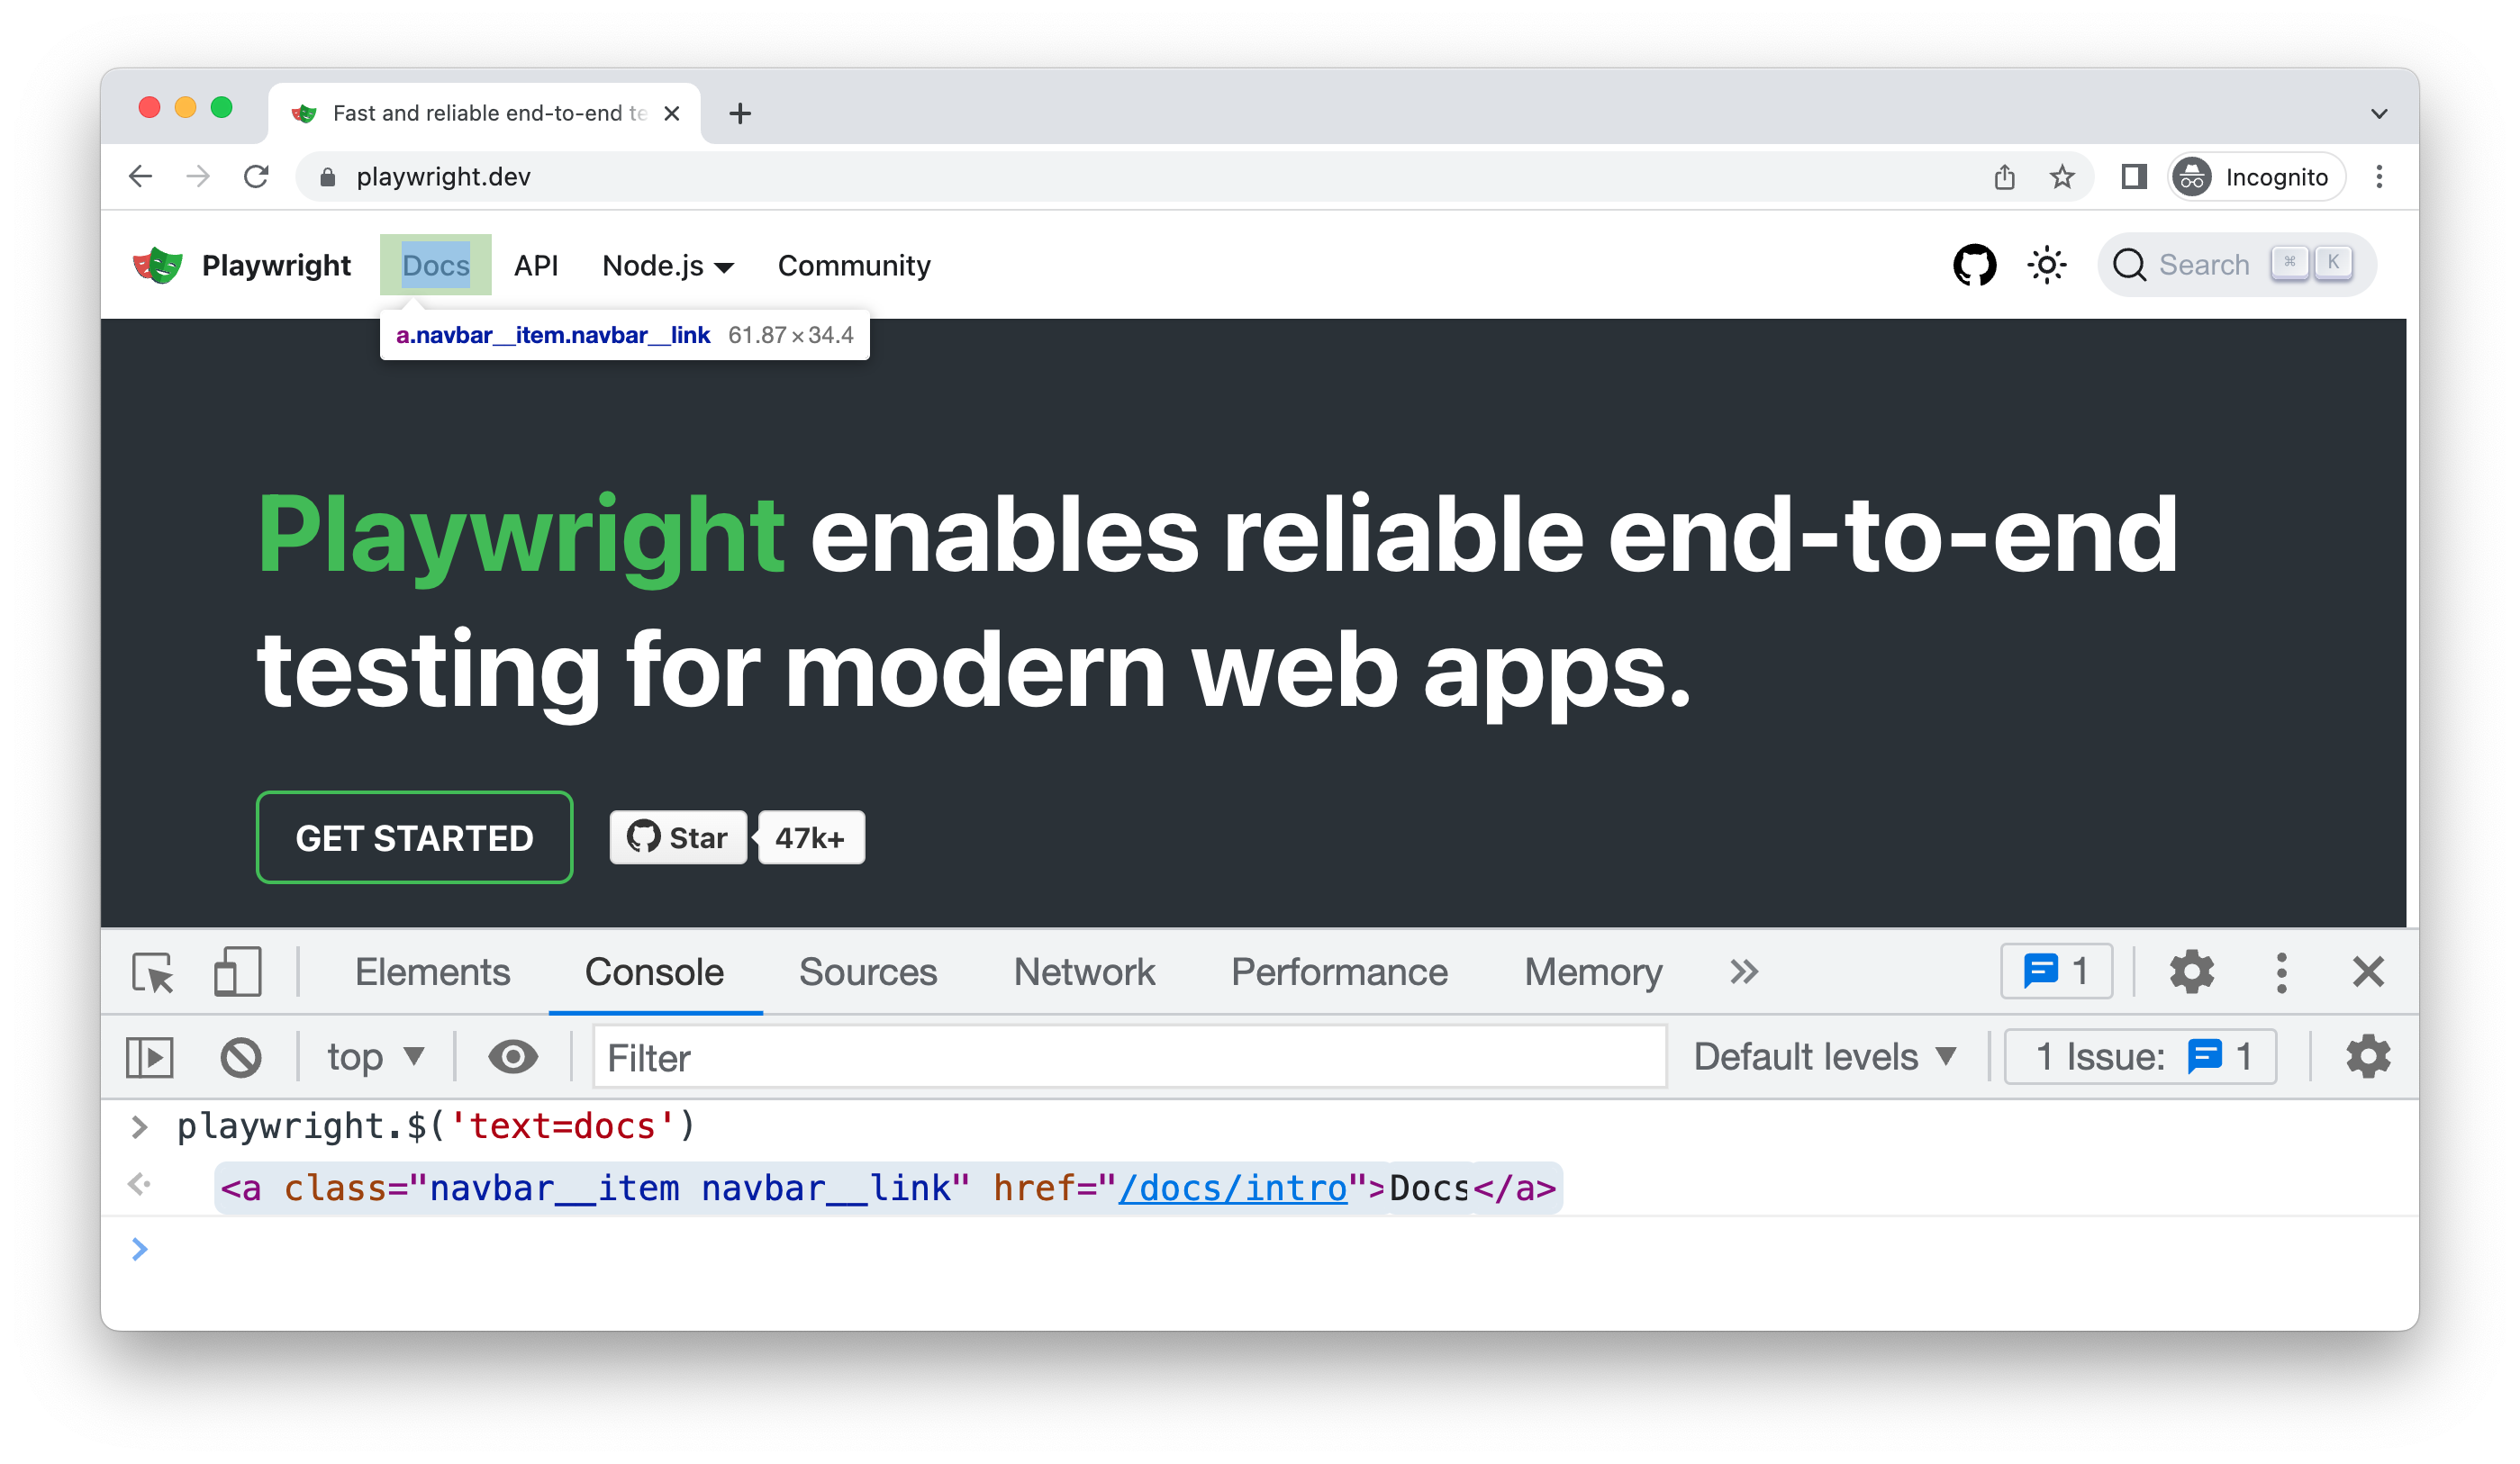
Once Playwright launches the browser window you can open the developer tools. The playwright object will be available in the console panel.
playwright.$(selector)
Query the Playwright selector, using the actual Playwright query engine, for example:
playwright.$('.auth-form >> text=Log in');

<button>Log in</button>
playwright.$$(selector)
Same as playwright.$, but returns all matching elements.
playwright.$$('li >> text=John')

[<li>, <li>, <li>, <li>]
playwright.inspect(selector)
Reveal element in the Elements panel.
playwright.inspect('text=Log in')
playwright.locator(selector)
Create a locator and query matching elements, for example:
playwright.locator('.auth-form', { hasText: 'Log in' });

Locator ()
  - element: button
  - elements: [button]
playwright.selector(element)
Generates selector for the given element. For example, select an element in the Elements panel and pass $0:
playwright.selector($0)

"div[id="glow-ingress-block"] >> text=/.*Hello.*/"
Verbose API logs
Playwright supports verbose logging with the DEBUG environment variable.
- Bash
- PowerShell
- Batch
DEBUG=pw:api npx playwright test
$env:DEBUG="pw:api"
npx playwright test
set DEBUG=pw:api
npx playwright test
For WebKit: launching WebKit Inspector during the execution will prevent the Playwright script from executing any further and will reset pre-configured user agent and device emulation.
Headed mode
Playwright runs browsers in headless mode by default. To change this behavior, use headless: false as a launch option.
You can also use the slowMo option to slow down execution (by N milliseconds per operation) and follow along while debugging.
// Chromium, Firefox, or WebKit
await chromium.launch({ headless: false, slowMo: 100 });