Trace viewer
Introduction
Playwright Trace Viewer is a GUI tool that lets you explore recorded Playwright traces of your tests, meaning you can go back and forward through each action of your test and visually see what was happening during each action.
You will learn
Recording a Trace
By default the playwright.config file contains the configuration needed to create a trace.zip file for each test. Traces are setup to run on-first-retry, meaning they run on the first retry of a failed test. Also retries are set to 2 when running on CI and 0 locally. This means the traces are recorded on the first retry of a failed test but not on the first run and not on the second retry.
import { defineConfig } from '@playwright/test';
export default defineConfig({
  retries: process.env.CI ? 2 : 0, // set to 2 when running on CI
  // ...
  use: {
    trace: 'on-first-retry', // record traces on first retry of each test
  },
});
To learn more about available options to record a trace check out our detailed guide on Trace Viewer.
Traces are normally run in a Continuous Integration (CI) environment, because locally you can use UI Mode for developing and debugging tests. However, if you want to run traces locally without using UI Mode, you can force tracing to be on with --trace on.
npx playwright test --trace on
Opening the HTML report
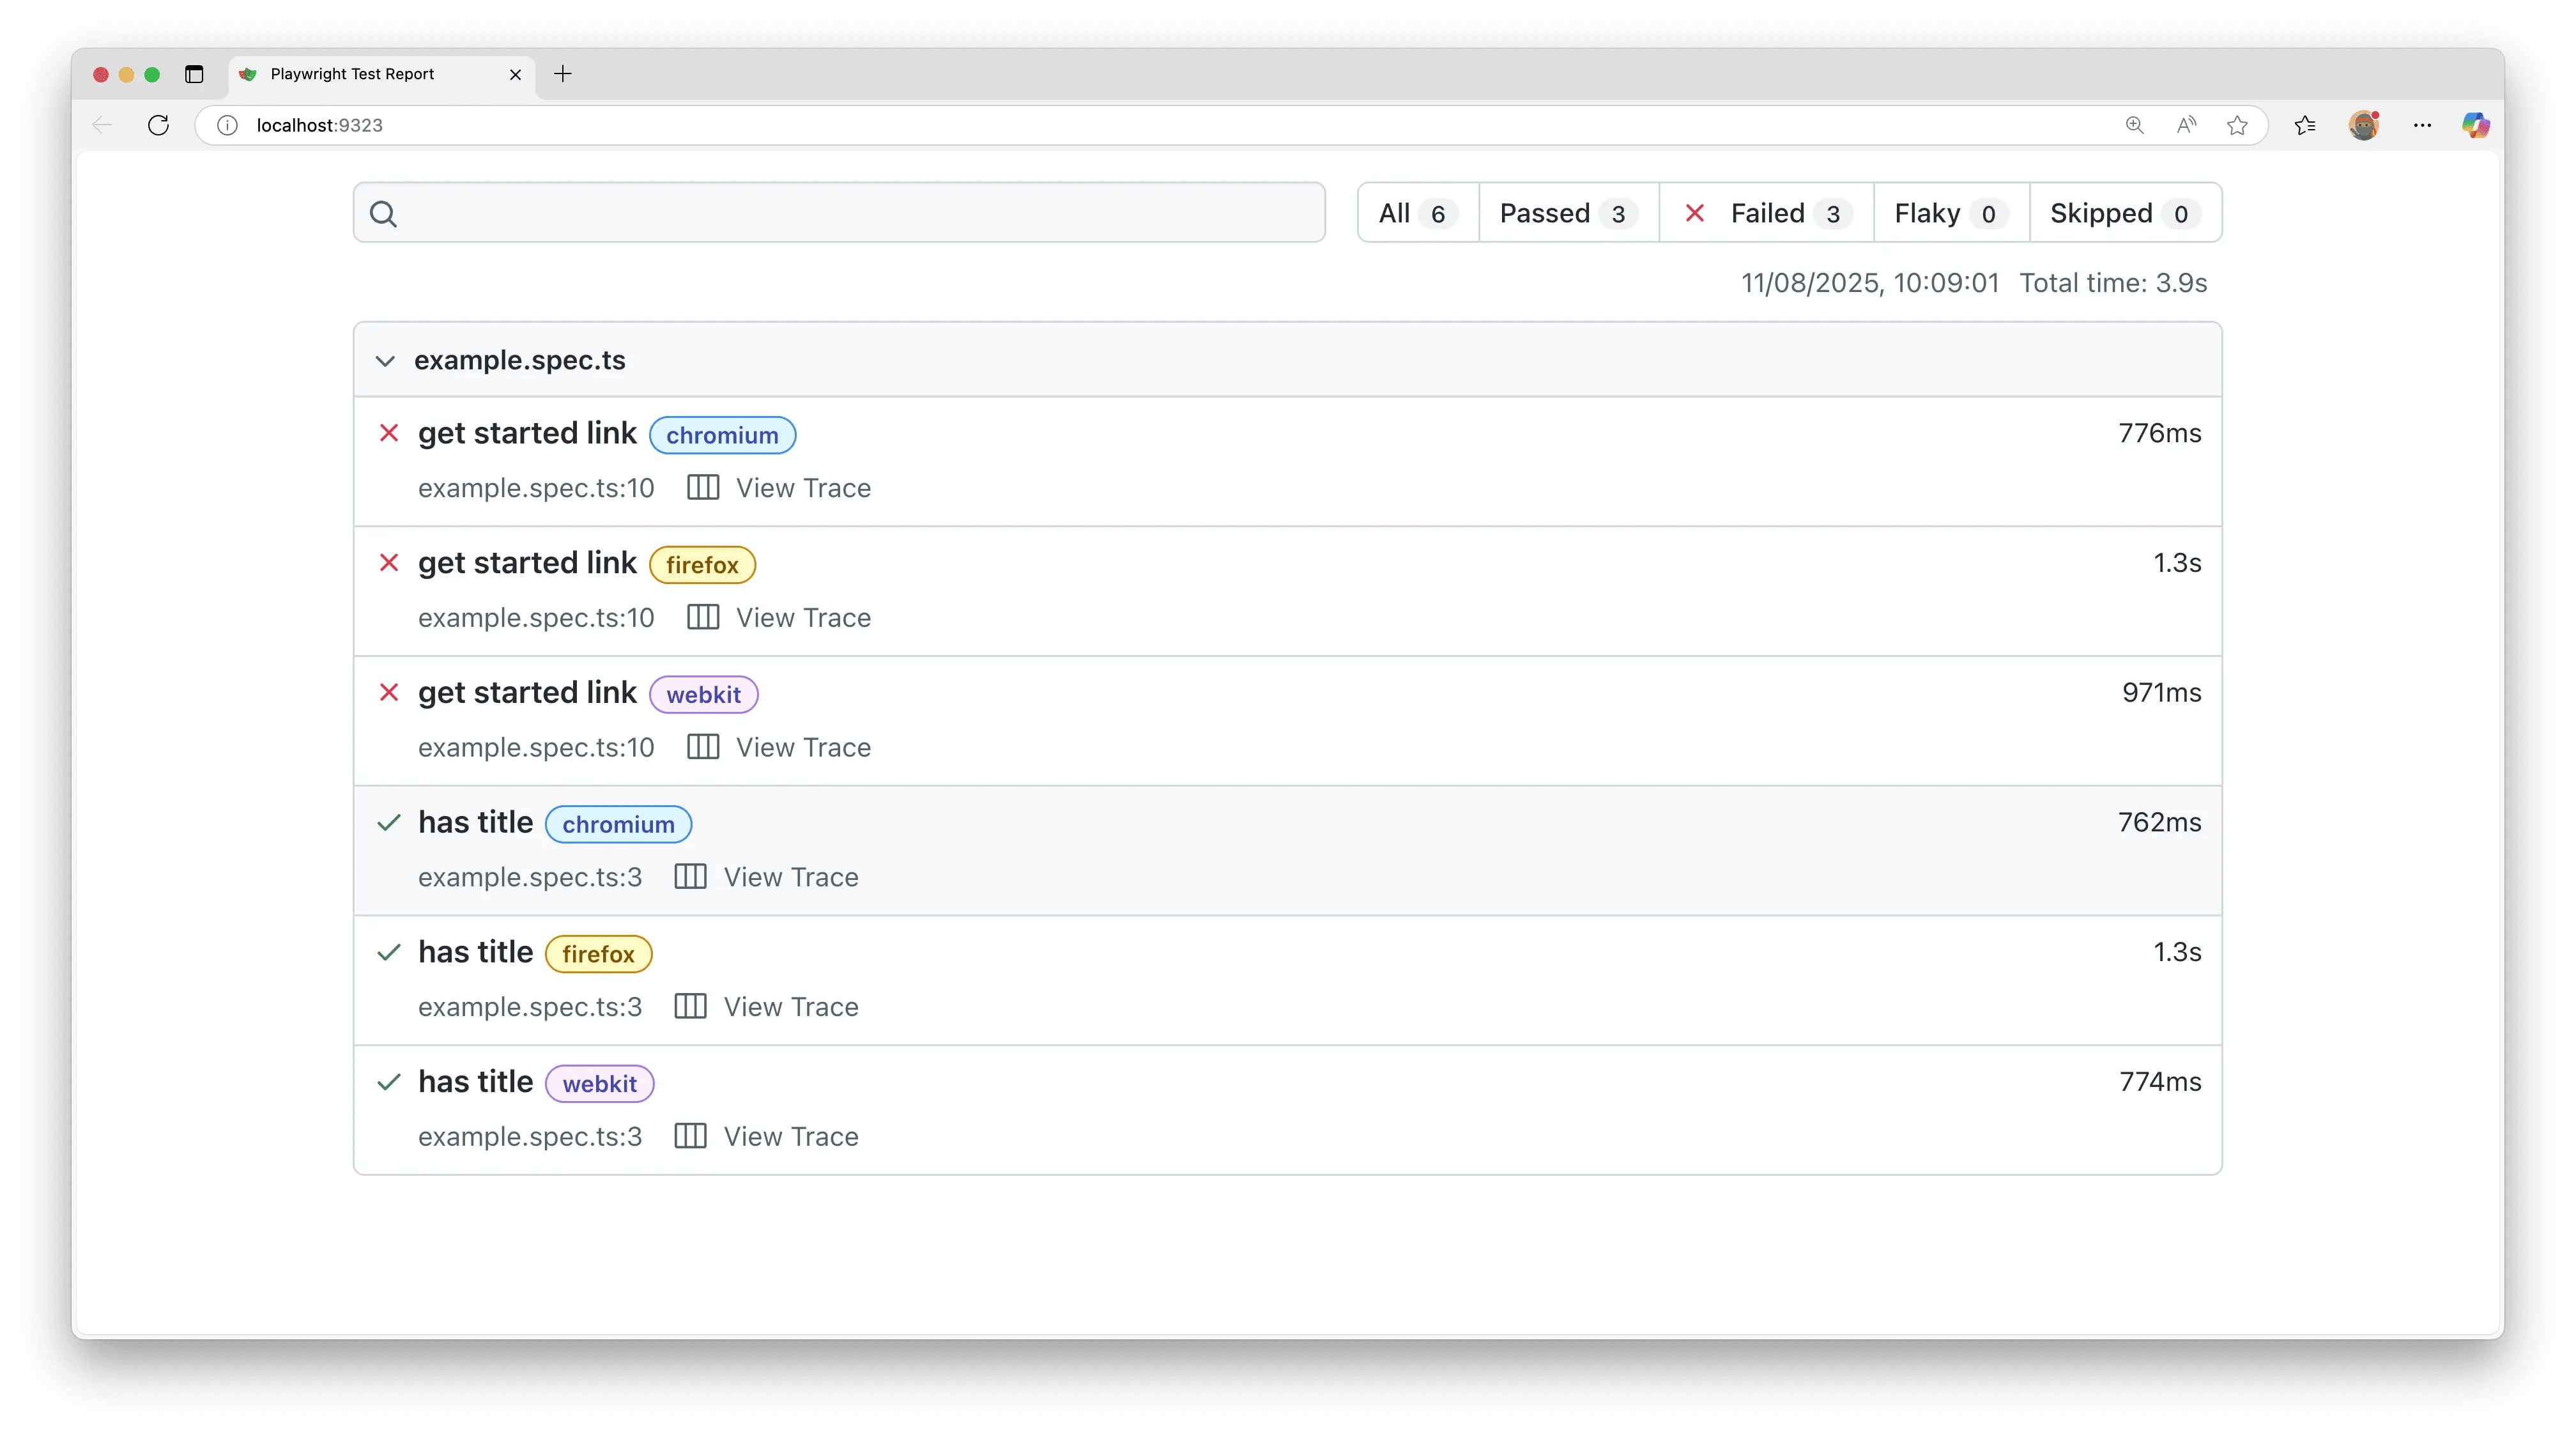
The HTML report shows you a report of all your tests that have been run and on which browsers as well as how long they took. Tests can be filtered by passed tests, failed, flaky, or skipped tests. You can also search for a particular test. Clicking on a test opens the detailed view where you can see more information on your tests such as the errors, the test steps, and the trace.
npx playwright show-report
Opening the trace
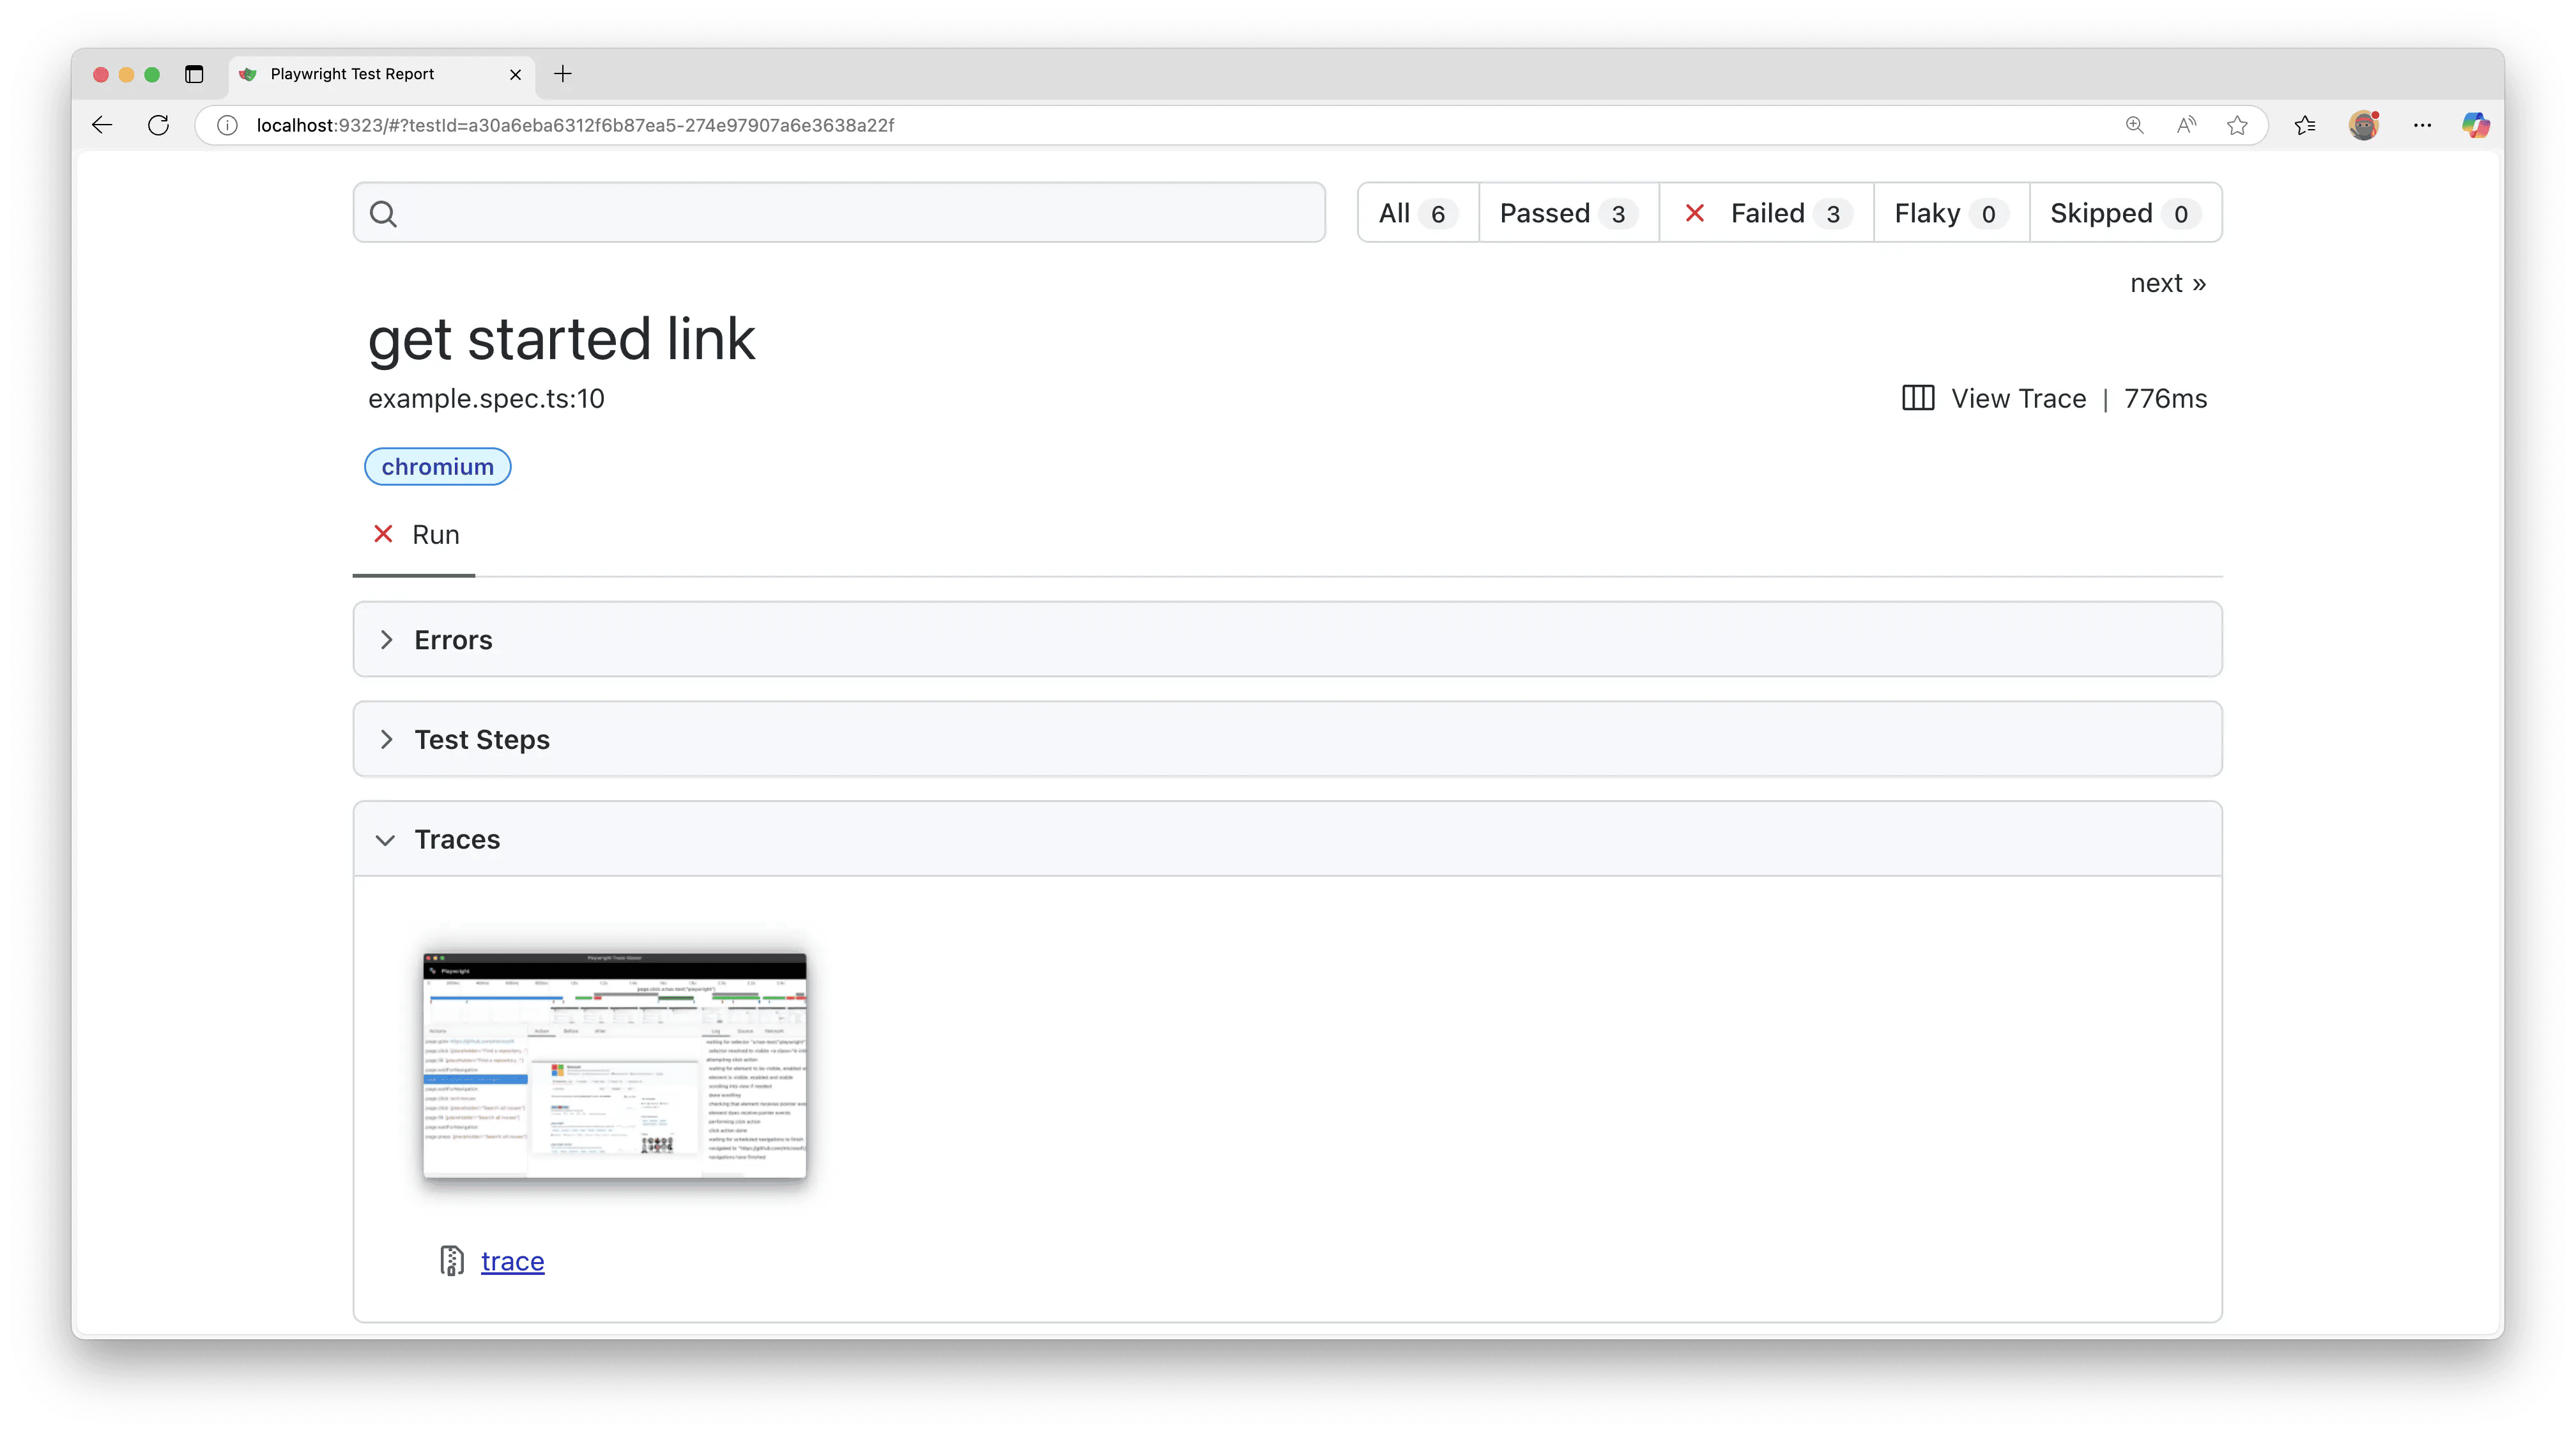
In the HTML report, click on the trace icon next to the test file name to directly open the trace for the required test.
You can also click to open the detailed view of the test and scroll down to the 'Traces' tab and open the trace by clicking on the trace screenshot.
To learn more about reporters, check out our detailed guide on reporters including the HTML Reporter.
Viewing the trace
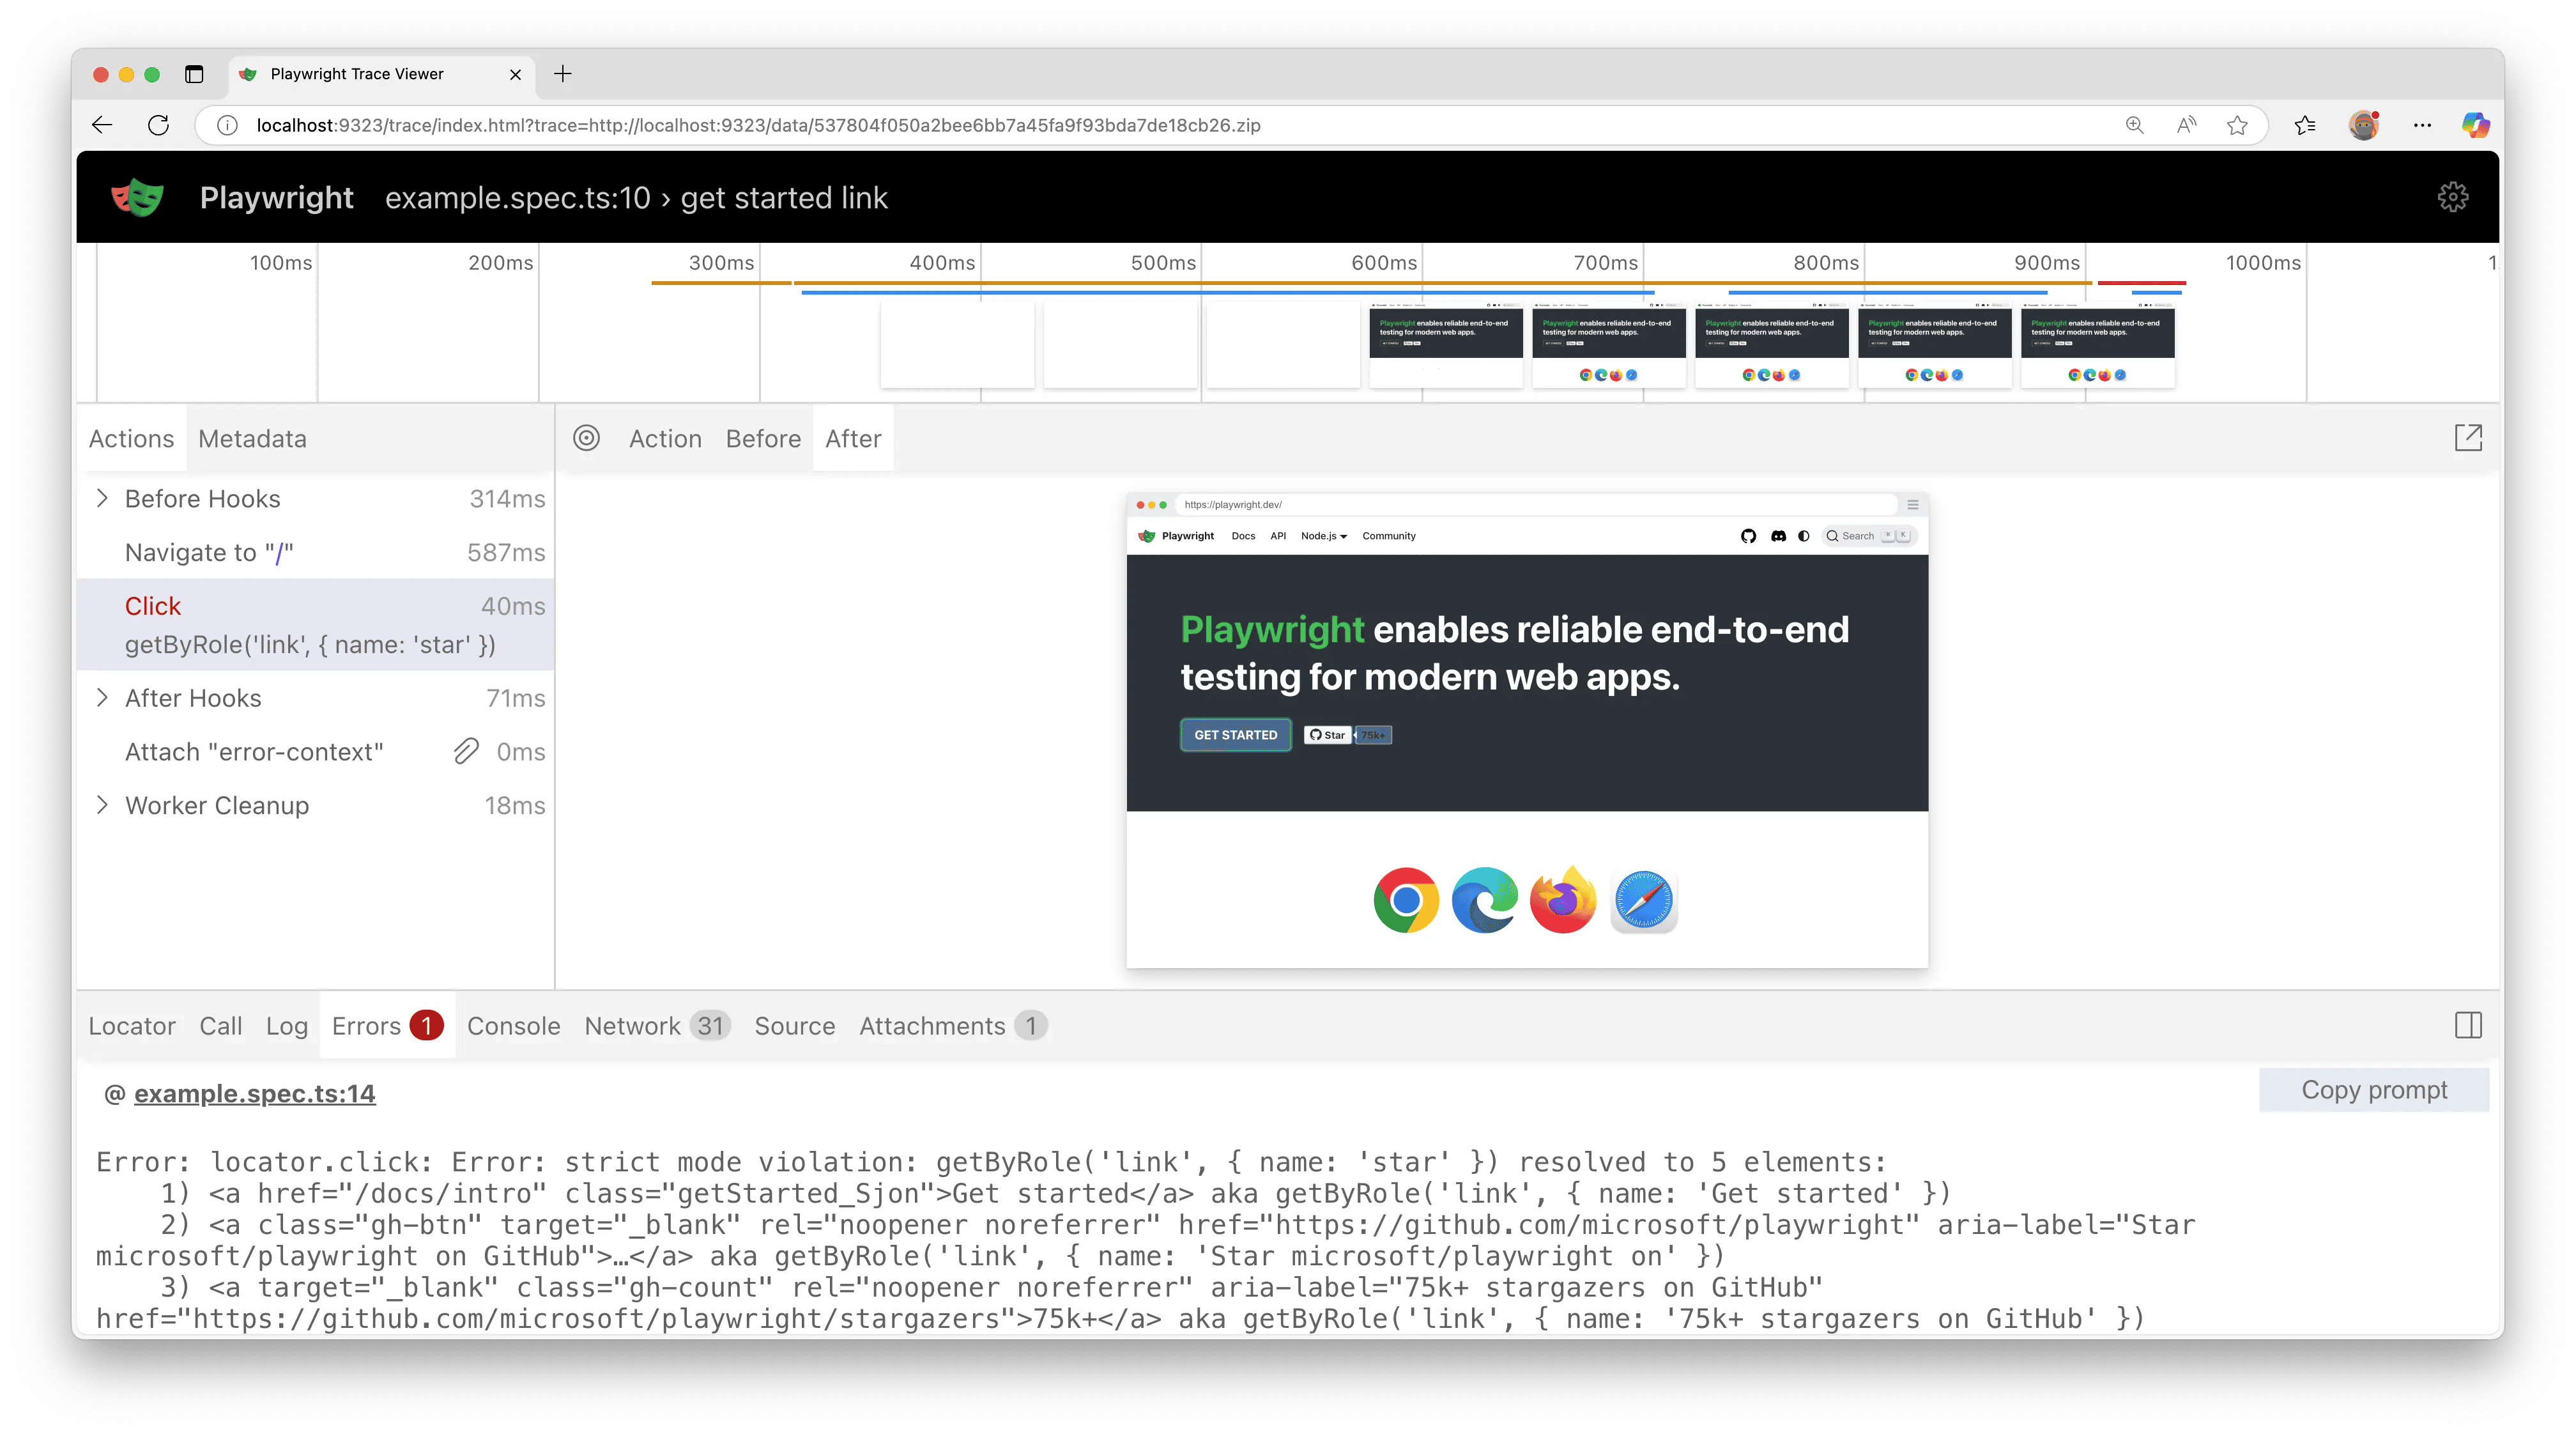
View traces of your test by clicking through each action or hovering using the timeline and see the state of the page before and after the action. Inspect the log, source and network, errors, and console during each step of the test. The trace viewer creates a DOM snapshot so you can fully interact with it and open the browser DevTools to inspect the HTML, CSS, etc.
To learn more about traces, check out our detailed guide on Trace Viewer.